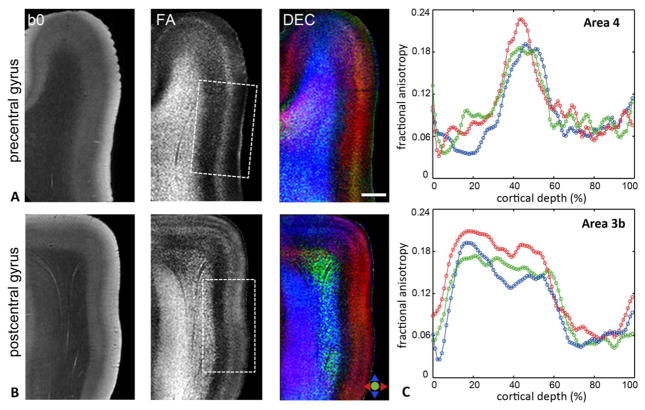
Figure 2.
A–B) b0, FA, and DEC maps through the precentral and postcentral gyri demonstrate region-specific contrasts resolved in the primary motor (area 4) and primary somatosensory (area 3b) cortices (areas indicated by the dashed white boxes). Colors in the DEC maps denote the primary orientation of diffusion as indicated by the color index. C) Plots show quantitative FA profiles measured as a function of cortical depth from the pial surface in areas 4 (top) and 3b (bottom) for the three subjects. Values plotted are mean FA measurements calculated over regions-of-interest of ~4 mm thickness in the cortical gray matter, with the abscissa normalized to percentage of total cortical depth for each subject. Scale bar = 2 mm.

