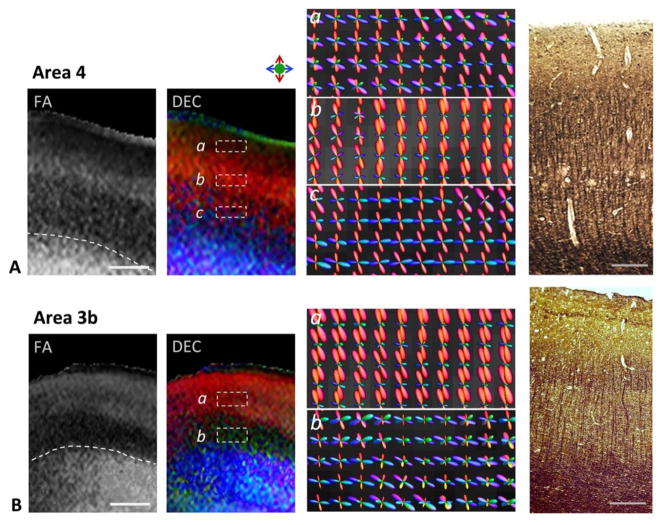
Figure 3.
Region-specific differences in the M1 (area 4, top panel) and S1 (area 3b, bottom panel) cortical areas seen with diffusion contrasts and estimated fiber orientation distributions across cortical depth. Representative sections through areas 4 and 3b with FA and DEC contrasts are shown. Dashed white lines indicate the boundary between gray matter and subcortical white matter in the FA maps. Panels a–c (in A) and a–b (in B) are high-magnification views showing reconstructed fODFs in different regions across the cortical depth (areas marked by dashed white boxes in DEC maps) in areas 4 and 3b, respectively. fODF surfaces are colored based on 3D spatial orientation as indicated by the color index. Corresponding silver-impregnated histological sections from areas 4 and 3b are shown in the right panel. Scale bars = 1 mm, scale bars for histology sections = 0.5 mm.

