Figure 5.

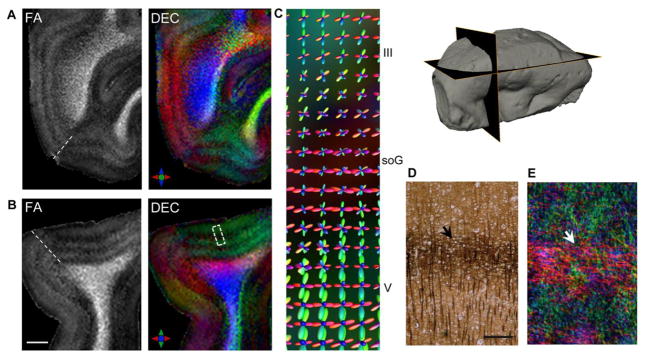
Delineation of the stria of Gennari (soG) based on diffusion MR contrasts in the primary visual area (Brodmann area 17). A–B) FA and DEC maps in orthogonal views demonstrate layer-specific variation in anisotropy resolved across the cortical gray matter. Note that the plane of the sections in A–B intersects the V1 surface at an oblique angle owing to the curvature of the cortical surface (indicated in the surface reconstruction at the top right). C) Magnified view shows reconstructed fODFs overlaid on the DEC map (corresponding to a small region within the dashed white box in B), indicating dominant tangential peaks in the soG in comparison to inner and outer adjoining cortical layers. Silver-impregnated histological section at the level of the soG (D) demonstrates the horizontal plexus of densely labeled fibers in the soG (black arrow) with radially-oriented fibers apparent in adjacent layers. E) Track-density map generated from probabilistic tractography indicates a band of dense crossing horizontal fibers corresponding to the soG (white arrow) and intervening radial fiber orientations resolved with the HARDI data. Scale bar for A-B = 2 mm, scale bar in D = 250 μm.
