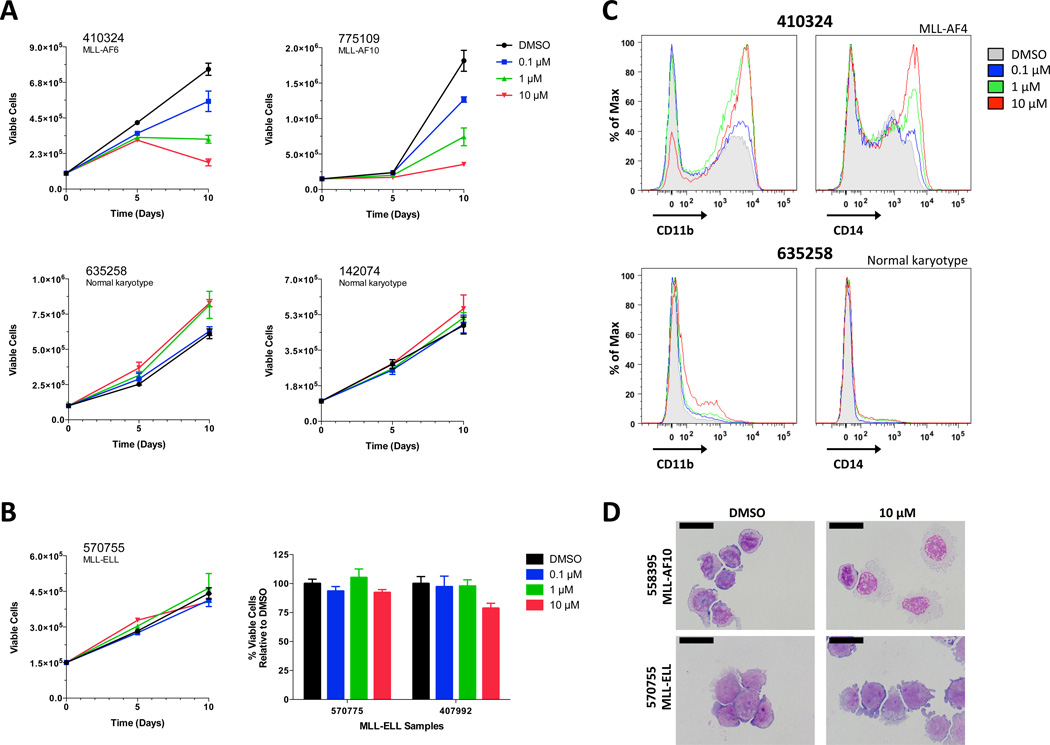
Figure 1. EPZ004777 Alters Growth and Differentiation of Primary AML cells with MLL rearrangements.
(A) Impact of EPZ004777 treatment on the growth of primary AML cells with (top panels) and without MLL rearrangements (bottom panels). Absolute cell numbers on y-axis; note different scales due to different rates of growth. Cells were expanded using a previously described stromal co-culture technique6 (also see methods in supplemental material) in the presence of DMSO or increasing concentrations of EPZ004777 (0.1 µM, 1 µM, 10 µM) over a 10-day period. Data represent mean values from two experiments assayed in duplicate ± SD (error bars). (B) Representative growth curve of MLL-ELL primary cells treated with increasing concentrations of EPZ004777 (left panel). Summary graph of cell growth results from two MLL-ELL samples treated with different doses of EPZ004777 (right panel); results are plotted as percent relative to DMSO control. Data represent mean values from two experiments assayed in duplicate ± SD (left) or SEM (right). (C) Histograms depicting the cell surface expression of myeloid markers CD11b (left panels) and CD14 (right panels) in two representative patient samples (one with a MLL translocation and one without). Cells were incubated in the presence of 10 µM EPZ004777 for 10 days and analyzed by flow cytometry. (D) Wright-Giemsa-stained cytospins of representative MLL and non-MLL rearranged patient samples treated for 10 days with DMSO or 10 µM EPZ004777. Scale bars represent 20 µm.

