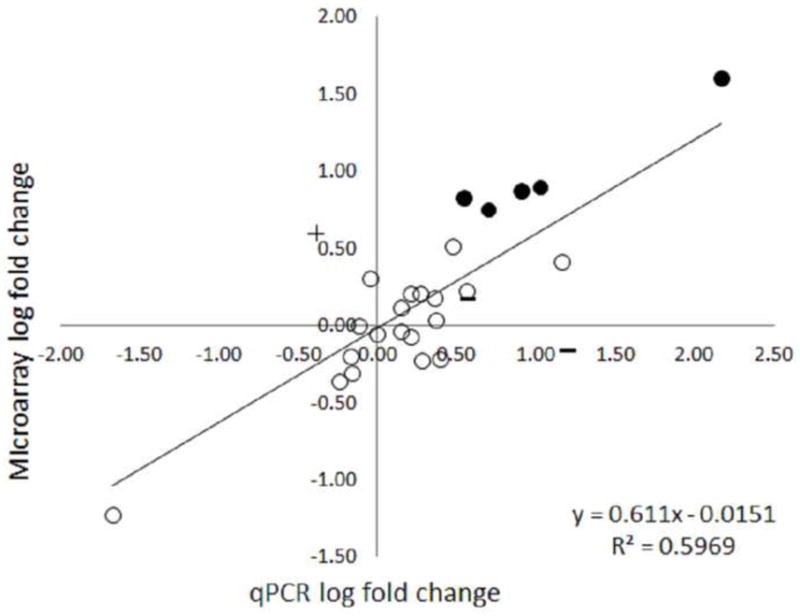
Figure 3.

Convergent validity of the new developed Aplysia Tellabs Array platform. Fold-change scores for 27 transcripts were compared when measured by microarray or qPCR. Each measurement is the average log-fold change (base 2) across 8 pairs of animals. Symbols indicate the degree of convergence in the assessment of statistical significance. Circles represent matches in assessment of statistical significance between microarray (> 1.1 fold change in either direction) and qPCR with both techniques indicating either non-significant (open circles) or significant (filled circles). False positives are marked with an + (significant in microarray but not in qPCR) and false negatives are marked with a – (significant in qPCR but not microarray).
