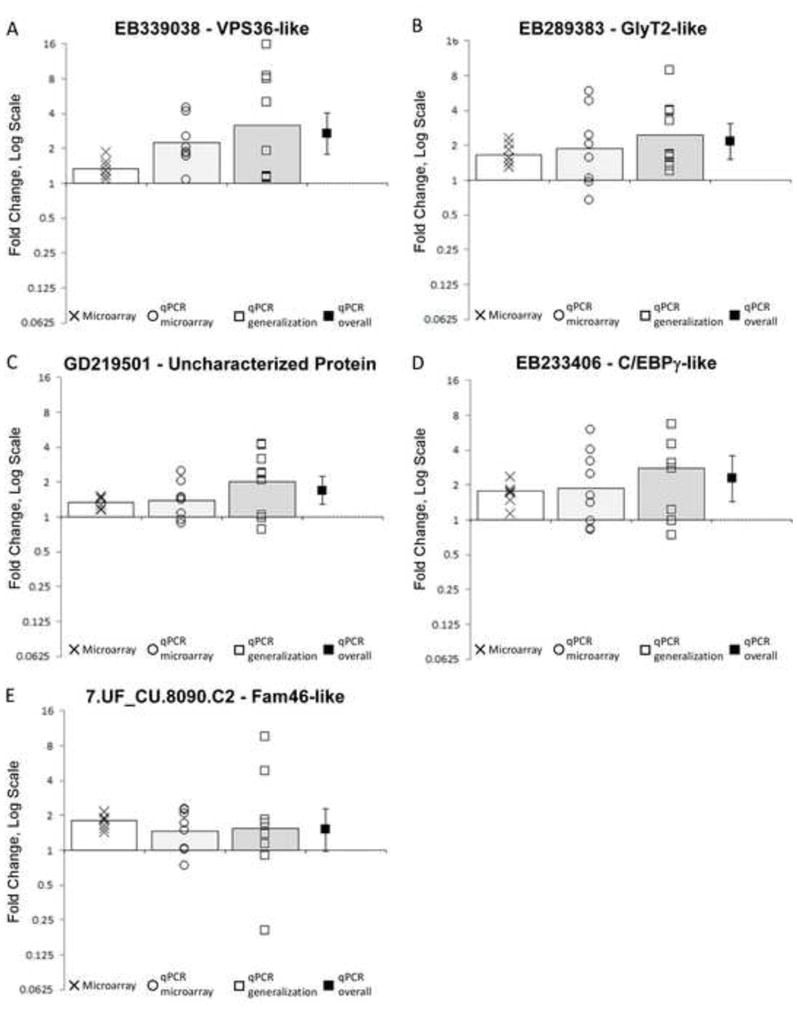
Figure 4.

Training-induced changes in gene expression in novel transcripts. These are results from the transcripts which were significantly regulated according to both microarray and qPCR in the original sample. Each panel shows data from the microarray analysis (Xs, n = 8 pairs of animals), qPCR on the same samples (circles, n = 8 pairs of animals) and qPCR from a second, independent sample (squares, n = 9–12 animals). Bars represent means for each analysis. The black square shows the overall average across all qPCR samples, with the error bar representing the 95% confidence interval. Where the confidence interval does not include 0 the transcript is significantly regulated at p < 0.05. Every comparison for every transcript is statistically significant at p < 0.05 except 7.UF_CU.8090.C2 in panel E which does not reach statistical significance in the second sample nor in the overall qPCR analysis.
