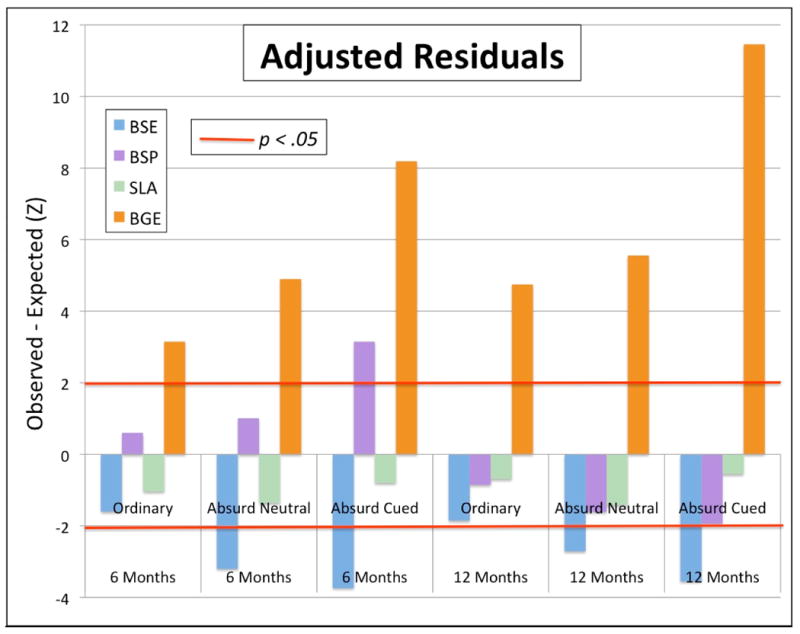
Figure 1. Adjusted residual analysis of smiling events following social looking. The red lines represent observed frequencies greater than or less than chance, respectively (p < .05). BSE = baby smiles at event; BSP = baby smiles at parent; SLA = baby smiles and looks away; BGE = baby gazes at event.