
Figure 1. Protein degradation tag characterization.
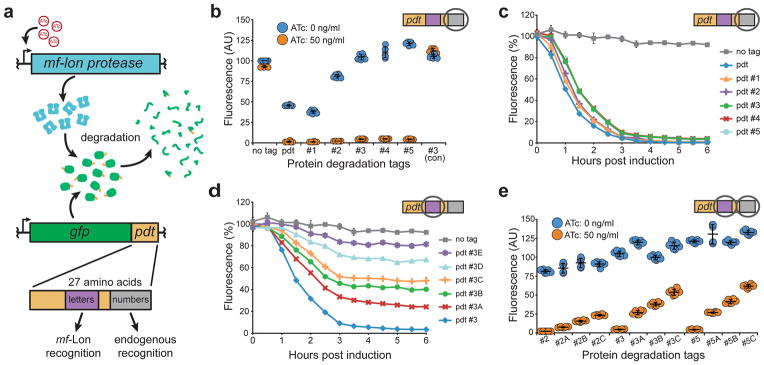
(a) Schematic of the tunable protein degradation system where anhydrotetracycline (ATc) induced mf-Lon expression allows the protease to degrade constitutively expressed GFP in a pdt-dependent manner. Mutations in two pdt regions produced tag variants with altered recognition by mf-Lon (letters) or endogenous E. coli proteases (numbers). (b) Dot plot of pdt number variants that show altered steady-state levels. Fluorescence was measured by flow cytometry 6 hours after ATc induction of cells in exponential growth. As an experimental control, the pdt#3 variant was tested in a strain that did not contain the mf-Lon expression cassette (#3 con). Fluorescence units are arbitrary, with untagged GFP set to 100, and show the mean of six biological replicates. P < 0.001 for ATc induction of each pdt variant except #3 (con). (c–d) Flow cytometry measurements of GFP degradation following mf-Lon induction with 50 ng/ml ATc. Data show the geometric mean fluorescence of at least 5,000 cells as a percentage of the non-induced control for each pdt variant. (c) Pdt number variants maintain similar mf-Lon-mediated degradation dynamics. (d) Pdt letter variants display altered mf-Lon-mediated degradation rates. (e) Dot plot of hybrid pdt variants. Strains expressing the indicated GFP-pdt fusion were measured by flow cytometry 6 hours after ATc induction. Fluorescence units are arbitrary with untagged GFP set to 100, and show the mean of six biological replicates. P < 0.001 for ATc induction of each pdt variant. The data in all panels show the mean of at least three biological replicates, and the error bars show the standard deviation.