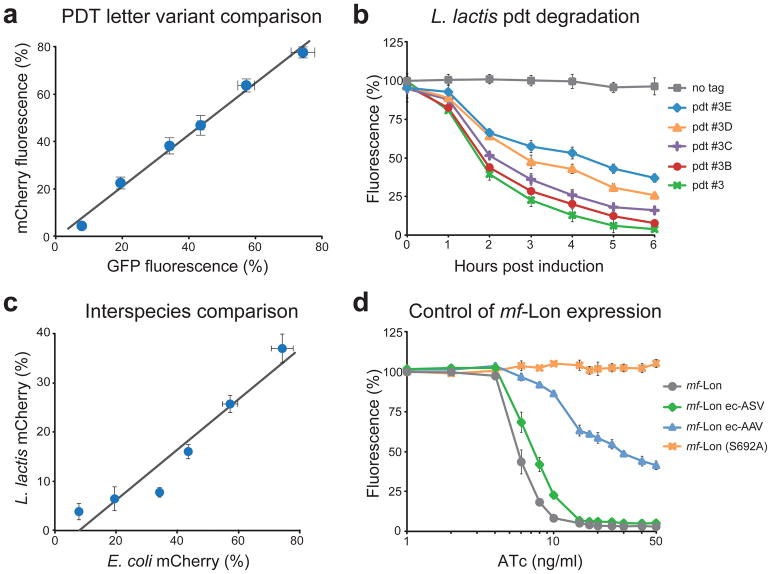
Figure 2. Pdt system characterization.
(a) Comparative analysis of pdt-mediated degradation of mCherry and GFP. Pdt letter variants were fused to GFP and mCherry, and the percent fluorescence remaining after mf-Lon induction is shown (50 ng/ml ATc for 6 h). Fluorescent data were collected by flow cytometry, and the pdt variants shown are pdt#3, #3A, #3B, #3C, #3D, #3E, listed in order of increasing percent fluorescence. The best-fit line by linear regression is y=1.09× – 0.01 with an R2 value of 0.98 and standard errors of 0.03 and 0.01 for the slope and y-intercept, respectively. (b) Pdt-dependent degradation of mCherry in L. lactis. Nisin induced mf-Lon expression in L. lactis causes pdt-dependent mCherry degradation. Data show the geometric mean fluorescence as a percent of the fluorescence of uninduced cells. Nisin induction was 3 ng/ml. (c) Comparative analysis of pdt letter variants in E. coli and L. lactis. Pdt letter variants were fused to mCherry, and the percent fluorescence remaining after mf-Lon induction is shown (6 hour induction, E. coli: 50 ng/ml ATc and L. lactis: 3 ng/ml nisin). Fluorescent data were collected by flow cytometry, and the pdt variants shown are pdt#3, #3A, #3B, #3C, #3D, #3E, listed in order of increasing percent fluorescence. The best-fit line by linear regression is y=0.51× – 0.04 with an R2 value of 0.91 and standard errors of 0.03 and 0.02 for the slope and y-intercept, respectively. (d) Transcription and post-translation-based control of mf-Lon-mediated pdt degradation. Inducible transcription provides control of mf-Lon-mediated degradation of GFP-pdt#3 across a range of ATc induction levels. Fusion of the E. coli ssrA tag variants ec-AAV and ec-ASV to mf-Lon shift the GFP degradation profile, and inactivation of mf-Lon protease activity (S692A) blocks GFP degradation. Data were collected 6 hours after ATc induction using GFP-pdt#3 as the degradation target. For all panels, the data show the mean of at least three biological replicates and the error bars show the standard deviation.

