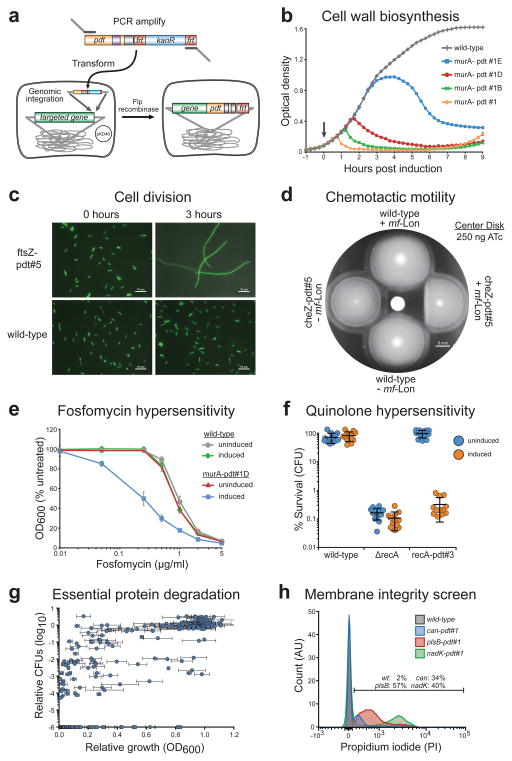
Figure 4. Tunable control of endogenous bacterial systems and antibacterial targets.
(a) Schematic of our recombineering method for genomic insertion of pdt variants, adapted from Datsenko and Wanner30. Red recombinase-assisted insertion of the desired pdt variant is followed by Flp recombinase-mediated excision of the accompanying kanR cassette. The resulting insertion contains the C-terminal pdt variant fusion and a 106 bp scar including the remaining FRT site. (b) Growth of strains following protease-driven depletion of MurA. Protease induction during early exponential phase growth (arrow) causes cells containing murA-pdt#1 to lyse within 1 hour, as measured by optical density (OD600). Cells containing the weakened pdt letter variants show a delayed response. Error bars show the standard deviation from the mean of six biological replicates. See Supplementary Figure 7 for data showing wild-type growth of non-induced cells. (c) DIC-fluorescence overlay images of cells after ATc induction for 3 hours. Cells containing ftsZ-pdt#5 form filaments while untagged wild-type bacteria maintain normal length. The fluorescence micrograph overlay showing constitutive GFP expression serves as a visual aid. Scale bars are 10 μm. (d) Disk diffusion assay on a chemotactic motility plate shows loss of chemotactic motility due to pdt-dependent CheZ degradation. Cells were stabbed into the chemotaxis plate following addition of 250 ng ATc to the center disk. Scale bar is 6 mm. (e) Cells containing murA-pdt#1D show increased sensitivity to fosfomycin upon simultaneous induction with 4 ng/ml ATc (induced). OD600 measurements were taken 4 hours after ATc and fosfomycin treatment and are presented as a percent of the OD600 of cells not exposed to fosfomycin (untreated). In the murA-pdt#1D strain, P < 0.001 when comparing uninduced and induced cells for fosfomycin concentrations between 0.05 and 2 μg/ml. See Supplementary Figure 8 for additional data. (f) Pdt-dependent degradation of RecA causes hypersensitivity to the quinolone norfloxacin that matches the known hypersensitivity of a recA deletion strain (ΔrecA). Where indicated, cells were induced with 50 ng/ml ATc for 2 hours before treatment with norfloxacin (25 ng/ml) for 2 hours. Survival was measured by colony forming units (CFU) and is presented as a percent of CFUs measured immediately before norfloxacin treatment. P < 0.001 for ATc induction of the recA-pdt#3 strain. (g) Scatter plot displaying the relative growth and CFU count of EPD library members after targeted mf-Lon degradation. Growth and CFU measurements are displayed as a ratio of induced/uninduced cells at 4 hours after ATc induction (50 ng/ml). CFU data points were placed at 1.0 × 10⁻⁶, the limit of detection, when colonies were not recovered from the induced well. Error bars show the standard deviation from the mean of three biological replicates. CFU ratios represent a single experiment. See Supplementary Table 2 for details. (h) Histogram of propidium iodide (PI) staining for EPD member plsB-pdt#1. PI was measured by flow cytometry 2 hours after induction with 50 ng/ml ATc. The percentage of cells that are PI+ is displayed. The data are normalized to mode and are representative of three biological replicates.

