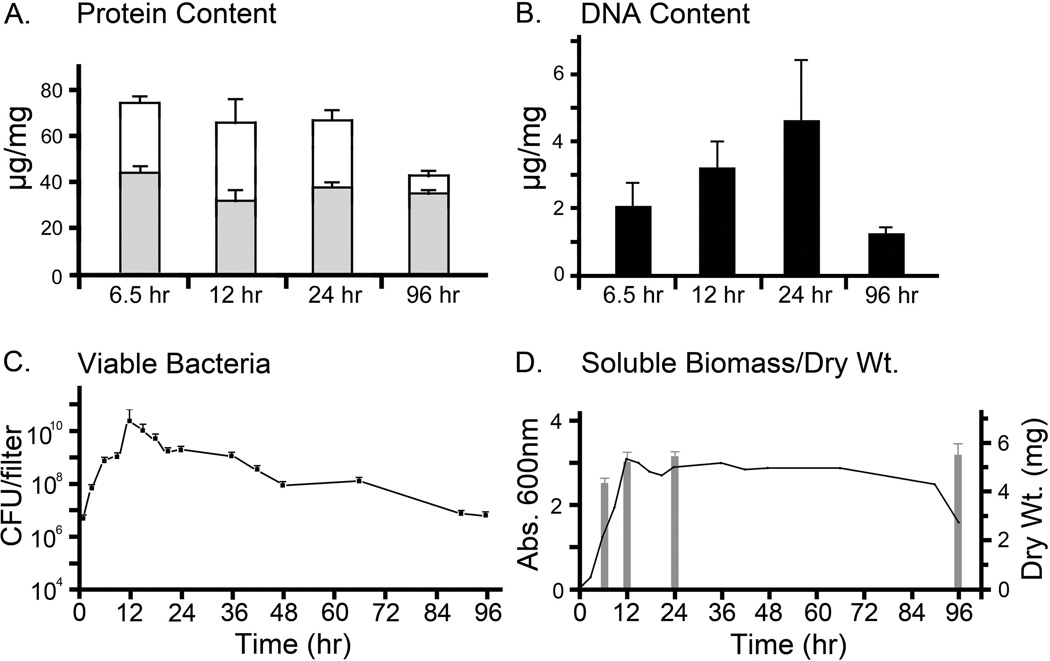
Figure 5. Protein, DNA and viable bacteria in the forming biofilms.
A. Protein content of non-ECM biofilm fraction (shaded bars) and of biofilm ECM (open bars) from NTHi biofilms. The biofilm ECM contained more protein than the non-ECM biofilm fraction, which contained mostly bacteria. The protein content of the non-ECM biofilm fraction remained mostly constant, while the protein content of the biofilm ECM dropped over time.
B. DNA content of ECM from NTHi biofilms. The amount of DNA in the ECM fraction of the biofilms increased until it peaked at 24 hr. DNA in the ECM from the 96 hr biofilm was much lower than DNA present in the 12 hr and 24 hr biofilms.
C. Colony biofilms were collected in PBS at increasing time intervals over a 96 hr period. The numbers of viable bacteria in these suspensions were estimated. Over the 96 hr period, the numbers of viable bacteria increased 12-fold by 12 hr but returned to initial inoculum levels by 96 hr. CFUs were 1 hr - 6.1x10⁶; 9 hr - 1.3x10⁹; 12 hr - 3.0x10¹⁰; 15 hr - 1.3x10¹⁰; 24 hr - 2.3x10⁹; 96 hr - 8x10⁶.
B. The OD600 of total biofilm material suspended in PBS (left scale) was used to estimate total biomass in the biofilms. The biofilm biomass peaked at 12 hr and remained at high levels but dropped at the last time point. Dry weights of forming biofilms, indicated with a bar histogram (and right scale), showed a rapid increase in biofilm biomass by 6.5 hr, increasing slowly to a maximum at 24 hr. The dry weight of the 96 hr biofilm was similar to that observed for the 12 hr and 96 hr biofilms.

