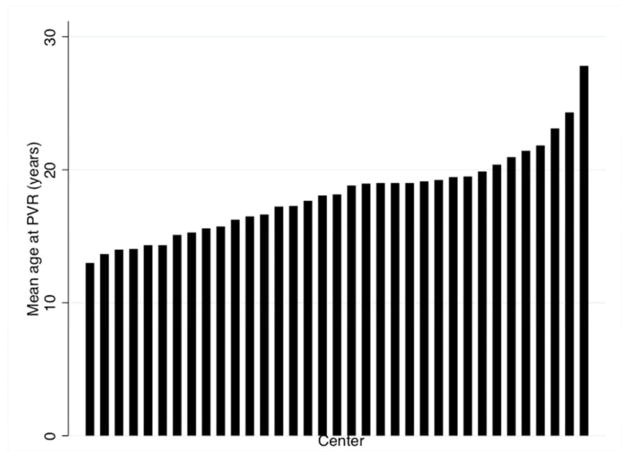
Figure 4. Mean age at PVR (2004-2012) by center.
This bar graph depicts the mean age at PVR across the 35 PHIS centers meeting inclusion criteria for this study. Test for heterogeneity in age between centers demonstrated significant heterogeneity in age at PVR by center mixed effects model (p<0.001).

