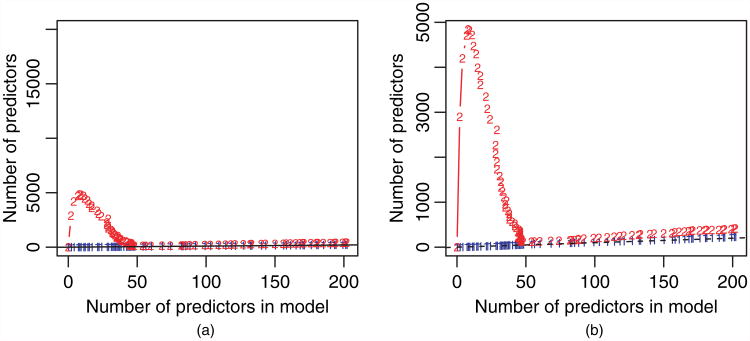
Fig. 10.
Gaussian lasso setting, N = 200, p =20000, pairwise correlation between features of 0.7 (the first 50 predictors have positive, decreasing coefficients): Shown are the number of predictors left after applying the strong sequential rule (6)(2) and the number that have ever been active (1) (i.e. had a non-zero coefficient in the solution) for values of λ larger than the current value (
 , unit slope line for reference); (b) is a zoomed version of the full scale plot (a)

