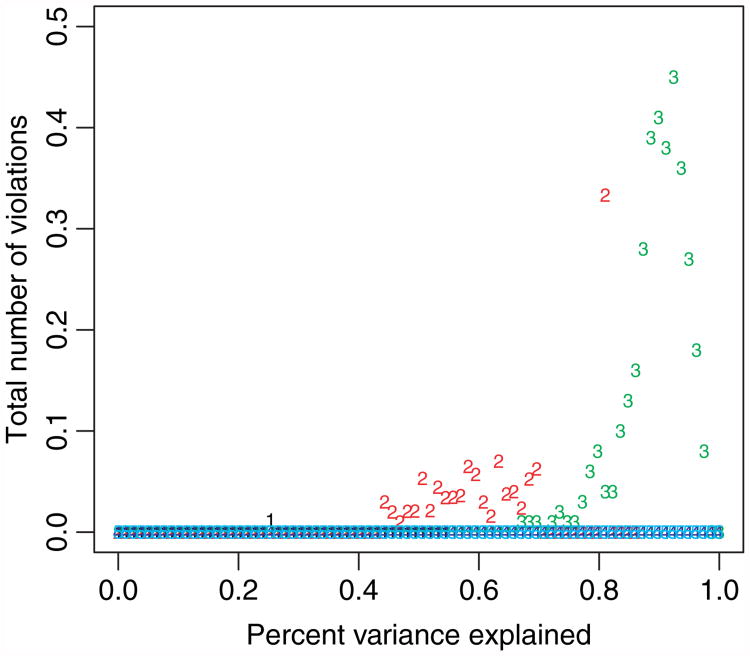
Fig. 6.
Total number of violations (out of predictors) of the sequential strong rule, for simulated data with N =100 and different values of p (1, p=20; 2, p= 50; 3, p= 100; 4, p=500; 5, p =1000): a sequence of models is fitted, over 100 decreasing values of λ from left to right; the features are drawn from a Gaussian distribution with pairwise correlation 0.5; the results are averages over 100 draws of the simulated data

