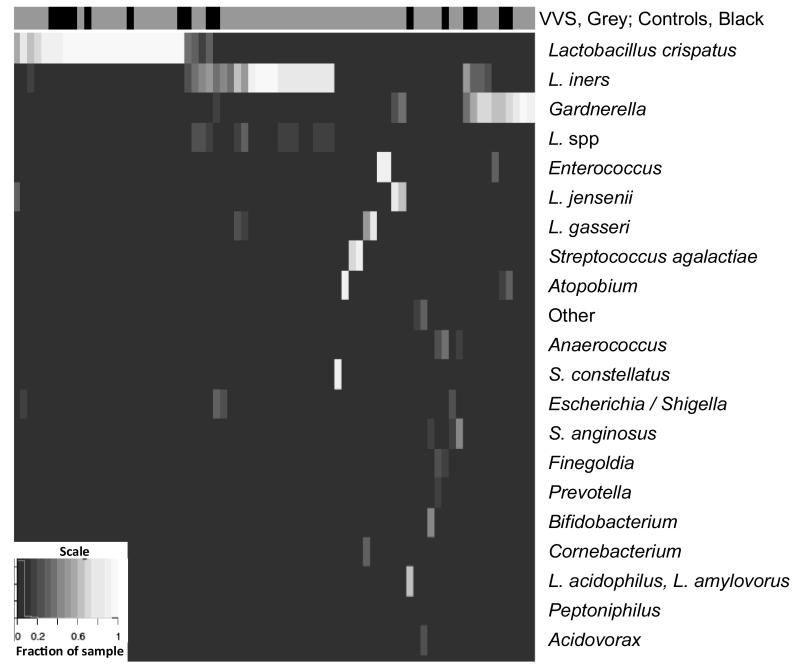
Figure 1.
Heat map showing the proportions of 21 bacterial taxa in vestibule samples from cases of VVS and control subjects. Each column is the sample from one woman and whether they exhibited VVS symptoms or not is shown in the top horizontal bar (VVS, grey; Controls, black). The proportions of bacterial populations found in vestibule samples of each woman are shown in columns with high (white) to low (black) proportions of each taxon in the sample.

