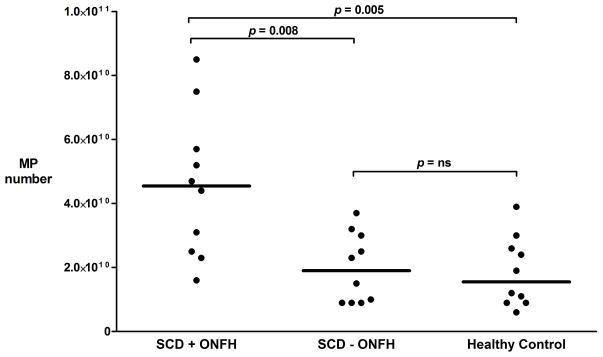
Figure 1.
Column scatter plot of MP levels obtained from SCD patients with ONFH (n = 10), SCD patients without ONFH (n = 10), and healthy controls (n =10). P-values represent non-parametric Kruskal-Wallis analysis. Horizontal lines indicate median values.
MP, microparticle; SCD, sickle cell disease; ONFH, osteonecrosis of the femoral head.

