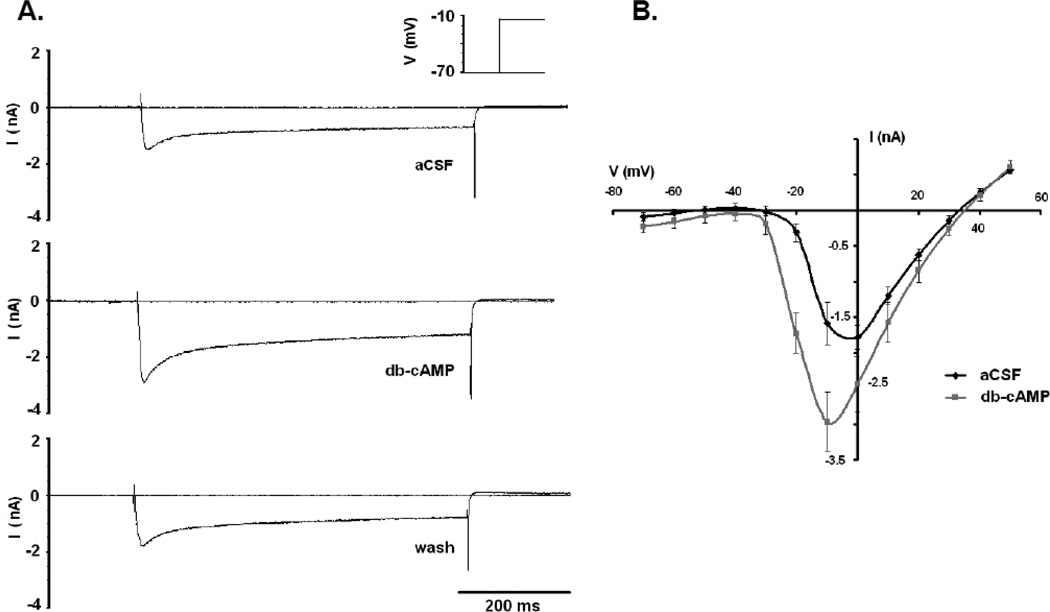
Figure 1.
The effects of db-cAMP (250 µM) on the Ca2+ current in LC neurons from neonatal rats older than P10. (A) Peak voltage-sensitive currents activated by a step from −70 mV to −10 mV in the presence of Na+ and K+ blockade and 3 mM BaCl2. Top trace is in aCSF, while middle trace is in the presence of db-cAMP. Note the large difference in the amplitude of inward current in the presence of the cAMP analogue and the long inactivation time, typical of L-type currents. Bottom trace is after 5 minutes of wash in aCSF, and reverses the increase in current amplitude induced by the cAMP analogue. (B) Average IV plot of current recordings under the same conditions as in (A). Resulting IV plots are characteristic for high voltage activated Ca2+ channels. Black trace is control in aCSF, while gray trace is in db-cAMP. Traces represent the mean ± SEM for 5 neurons.

