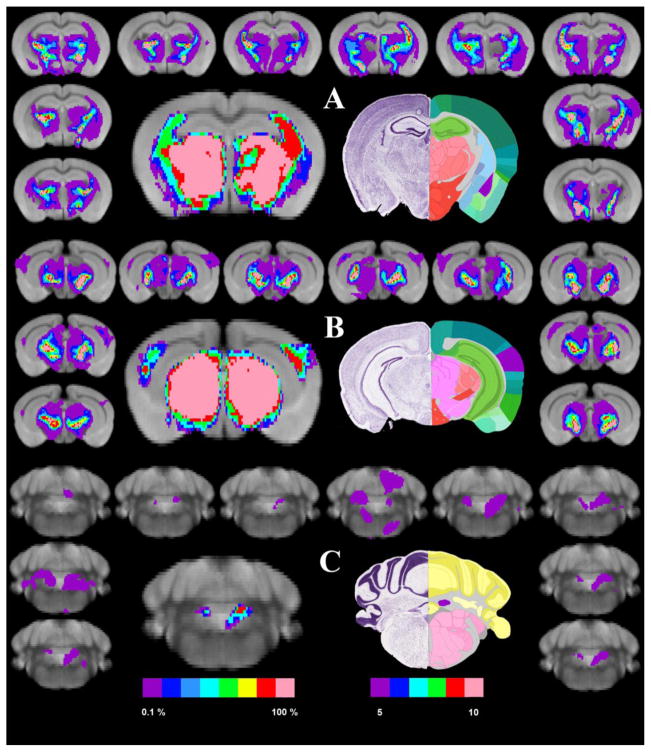
Figure 3. The Probabilistic Connections of the Mouse Medial Geniculate Nucleus.
Panel A shows the connectivity of the MGN/S and the caudate/putamen (light blue) and the amygdala (highlighted in purple, along with the thalamus and hypothalamus. Following the layout of the previous figures, the left central figure is the summation of the thresholded and binarized probabilistic tractography results from all participants overlaid onto our standard 24 average mouse brain (5 of 10 mice showing the connectivity). The surrounding smaller brains are the individual probabilistic tractography results overlaid onto the standard mouse brain. The right central figure is the closest corresponding section from the Paul Allen brain atlas. Panel B shows the connectivity of the medial geniculate and the thalamus, hypothalamus, auditory cortex, and portions of the midbrain and spinal tracts. Panel C shows the connectivity of MGN/S and cerebellum.

