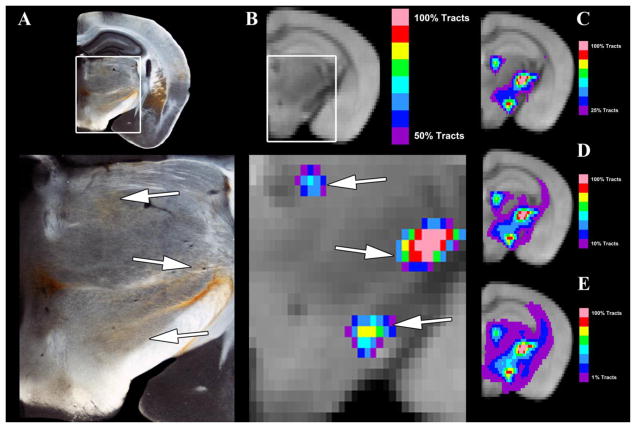
Figure 4. A Focused Comparison of Anterograde Tracing and Probabilistic Tractography in the Midbrain and Thalamus.
Panel A shows the BDA anterograde tracing results for injections into the MGN/S, with notable pathways to the hypothalamus (zona incerta and lateral hypothalamus) and thalamus (lateral posterior and central median nucleus). Panel B shows an extensively thresholded (50% of tracts) average tractography results, which corresponds to the Panel A, that accurately correspond to those in Panel A (indicated with white arrows). Panel C–E shows the same average probabilistic tractography, though with different threshold values. Note that Panel A has rather diffuse tracts running across the thalamus and hypothalamus, which are most closely recapitulated in Panel E with the 1% threshold. Yet even at the 1% threshold there is a loss of the auditory cortex connections that are apparent at 0.1% thresholding in Figure 4B.

