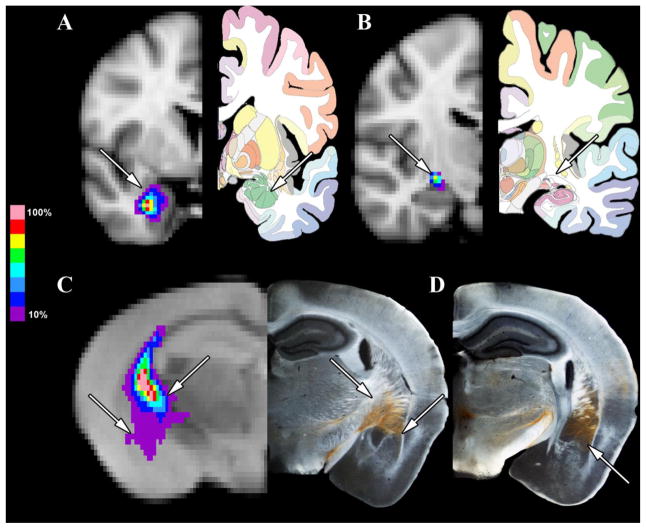
Figure 5. A Focused Comparison of Human and Mouse MGN/S and the Amygdala.
Panel A shows the average probabilistic tractography (thresholded at 10%) between the human MGN/S and amygdala (the amygdala is indicated by the white arrow). Panel B shows a section posterior to Panel A to highlight that the pathway between the MGN/S and amygdala is the internal capsule (indicated by the arrow). In parallel, Panel C the average probabilistic tractography results (thresholded at 10%) between the mouse MGN/S and the amygdala, along with the concordance to the anterograde tracing results (lateral white arrows point out the amygdala, medial white arrows point out the fibers of passage through the internal capsule). Panel D shows the more extensive amygdala connections in an adjacent posterior section.

