
Fig. 2.
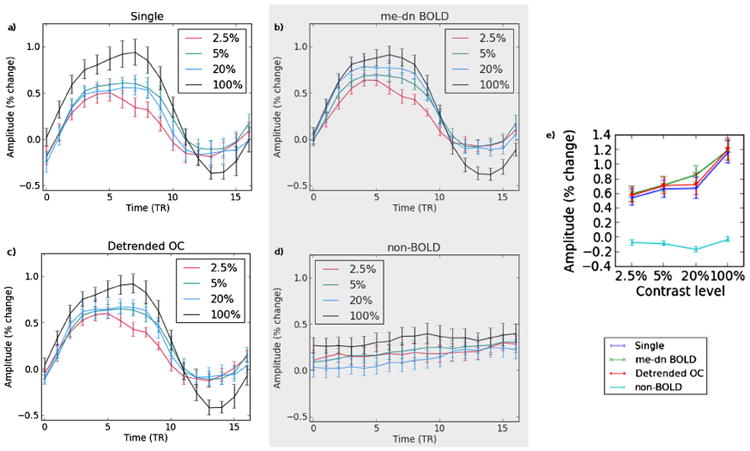
The contrast response curves are shown for a) single echo, b) me-dn BOLD, c) optimally combined (OC), and d) non-BOLD time series for the 2.5%, 5%, 20% and 100% contrast levels. Part e) shows the magnitude of the difference between the maximum and baseline for all time series types.