
Fig. 3.
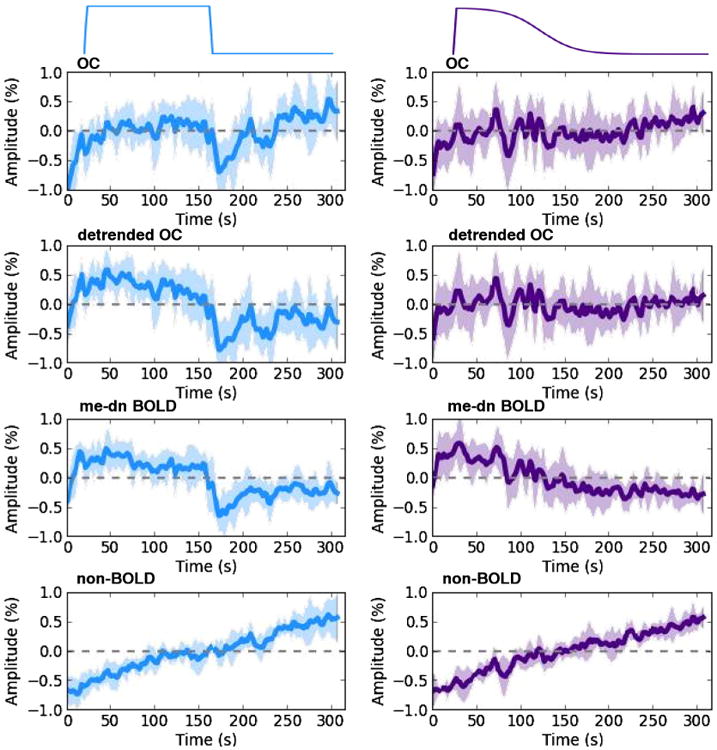
Group average time series taken over voxels in V1 for the 20% block and ramp tasks for the OC, detrended OC, me-dn BOLD, and non-BOLD components where the thick line is the mean and the shading is the standard error, the data are demeaned.
Official websites use .gov
A
.gov website belongs to an official
government organization in the United States.
Secure .gov websites use HTTPS
A lock (
) or https:// means you've safely
connected to the .gov website. Share sensitive
information only on official, secure websites.
Group average time series taken over voxels in V1 for the 20% block and ramp tasks for the OC, detrended OC, me-dn BOLD, and non-BOLD components where the thick line is the mean and the shading is the standard error, the data are demeaned.