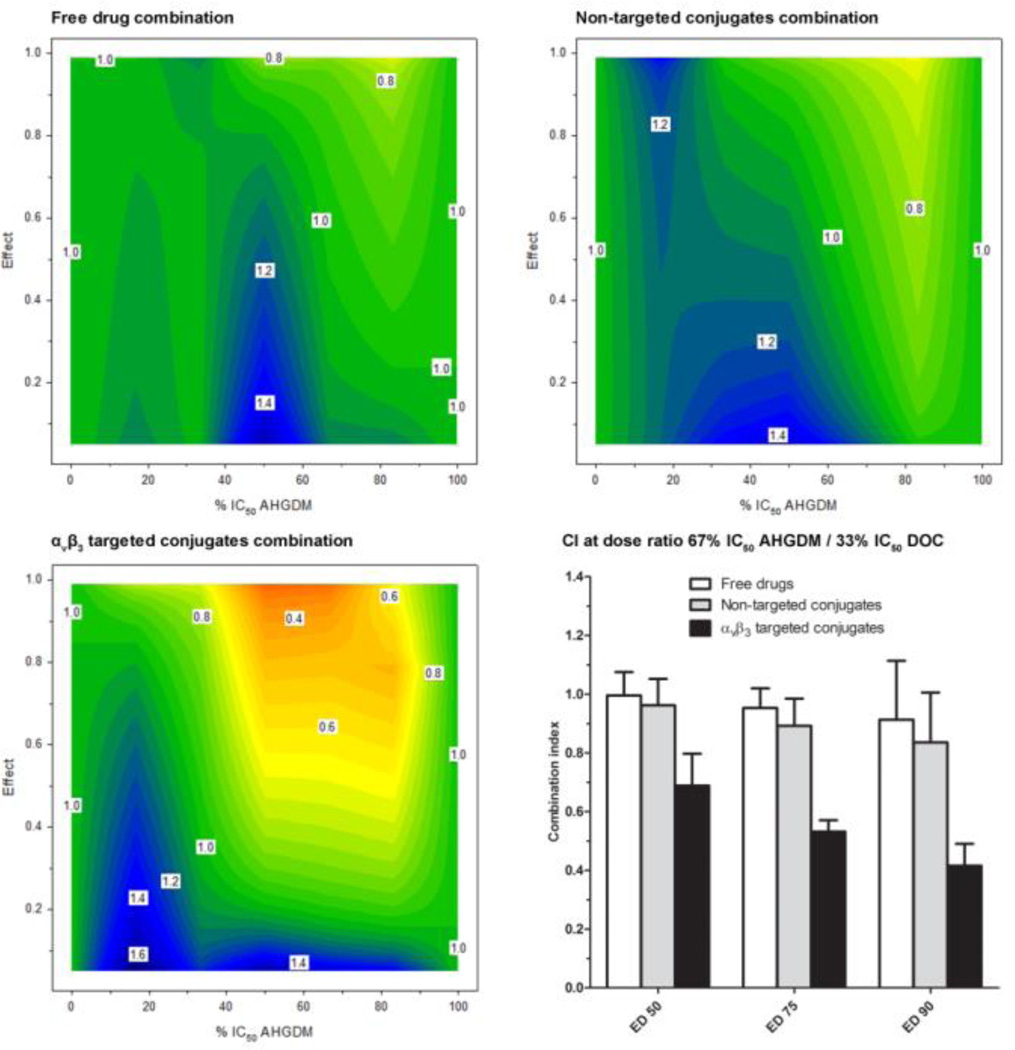
Figure 5. In vitro combination index analysis.
The combination index (z-axis) was evaluated as a function of drug ratio (x-axis) and effect (y-axis). Three combination treatments were evaluated: 1) Free drug combination (AHGDM + DOC), 2) Non-targeted conjugates combination (p-AHGDM + p-DOC), and 3) αvβ3 targeted conjugates combination (p-AHGDM-RGDfK + p-DOC-RGDfK). Various (5) drug ratios were evaluated and effect was defined as (1- [% relative viability / 100]). Combination treatment with αvβ3 targeted conjugates demonstrated marked synergism at drug ratios ranging from 50% IC50 AHGDM + 50% IC50 DOC to 83% IC50 AHGDM + 16% IC50 DOC at effect levels above 0.5. A combination treatment of αvβ3 targeted conjugates at the optimum drug ratio of 67% IC50 AHGDM + 33% IC50 DOC demonstrated significantly higher synergism as compared to combinations of either non-targeted conjugates or free drugs. Data expressed as mean ± SD of three independent experiments, with 3 samples per experiment.

