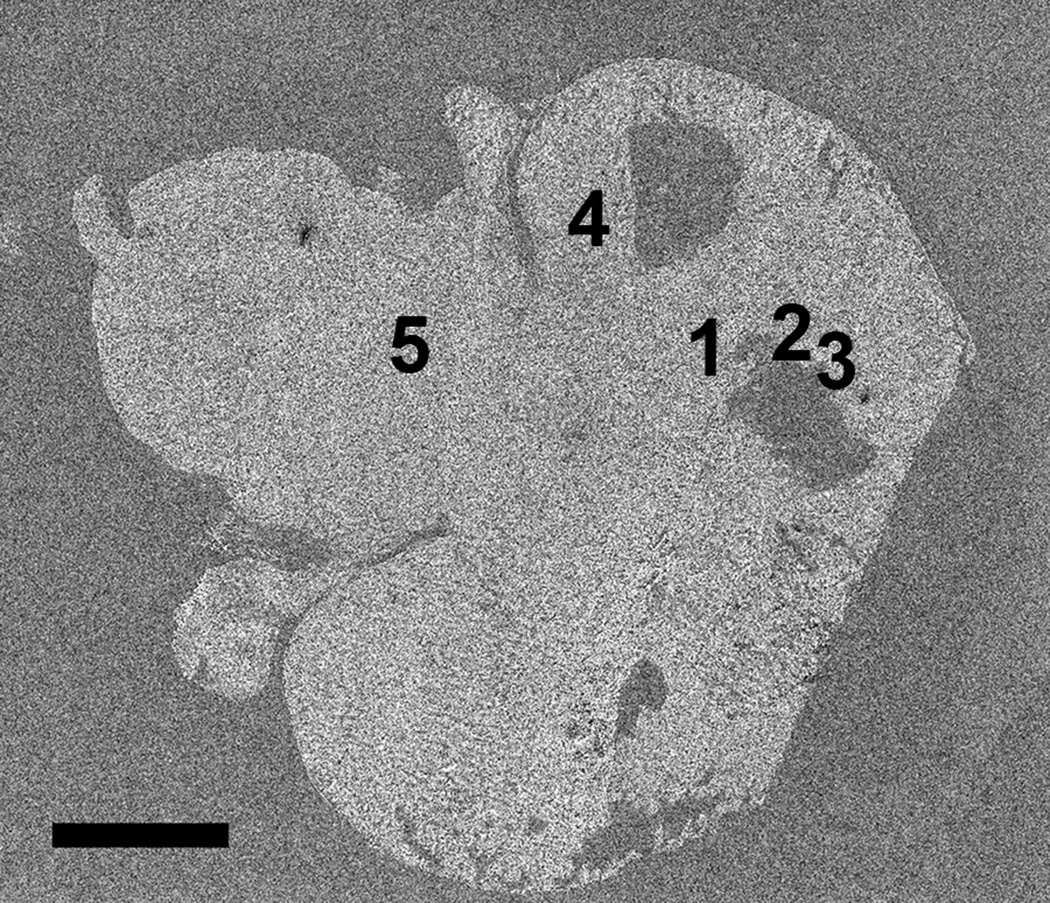
Figure 5.
SEM secondary electron montage image of brain tissue section with positions 4 and 5 corresponding to regions without MPRs and positions 1-3 corresponding to regions of tissue where MPRs were located. Note that the MPRs were located in regions surrounding a section of missing tissue. Scale = 2.5 mm

