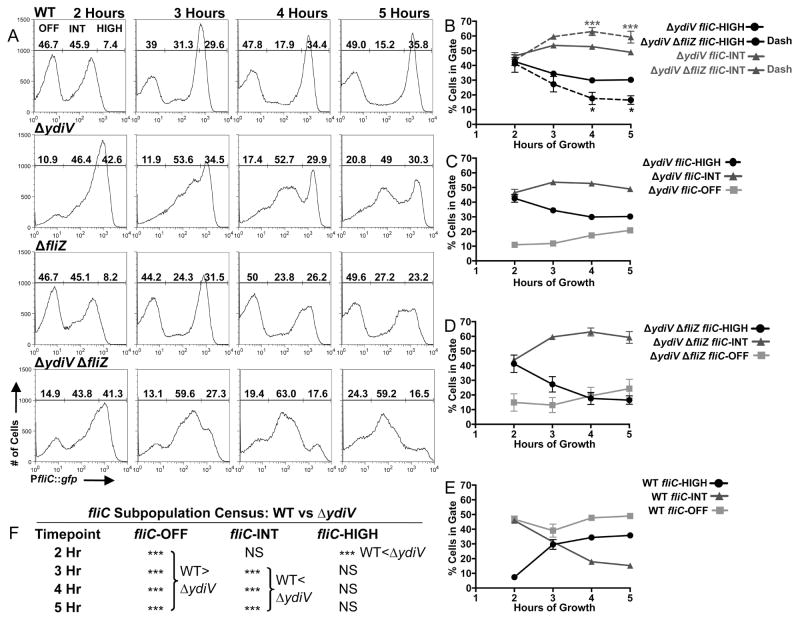
Figure 4.
Inversion of bistability in the absence of fliZ and ydiV. A) Flow cytometry census of fliC expression for WT (BC2117) and the ΔydiV (BC2118), ΔfliZ (BC2119), and ΔydiV ΔfliZ (BC2675) mutants. B) Comparisons of fliC-HIGH and fliC-INT subpopulations for the ΔydiV and ΔydiV ΔfliZ mutants. Black asterisks (bottom of figure) reference comparisons between population percentages in the fliC-HIGH gate, dark grey asterisks (top of figure) reference comparisons between population percentages in the fliC-INT gate. There were no significant differences between the ΔydiV and ΔydiV ΔfliZ strains in the sizes of the fliC-OFF subpopulations. C, D and E) Kinetics of subpopulation flux for strains ΔydiV (C), ΔydiV ΔfliZ (D), and WT (E, from this set of experiments, distinct from WT data represented in figure 2). F) Significance of comparisons between WT and the ΔydiV mutant. Histograms in (A) depict the results of one representative experiment; associated subpopulation percentages in (A) are the means of three independent experiments. Line graphs in (B–E) represent the means with standard deviation of the three independent experiments. One-way ANOVA with Tukey’s multiple comparisons test was used to compare all strain/timepoint values. *p<0.05, **p<0.01, ***p<0.001.

