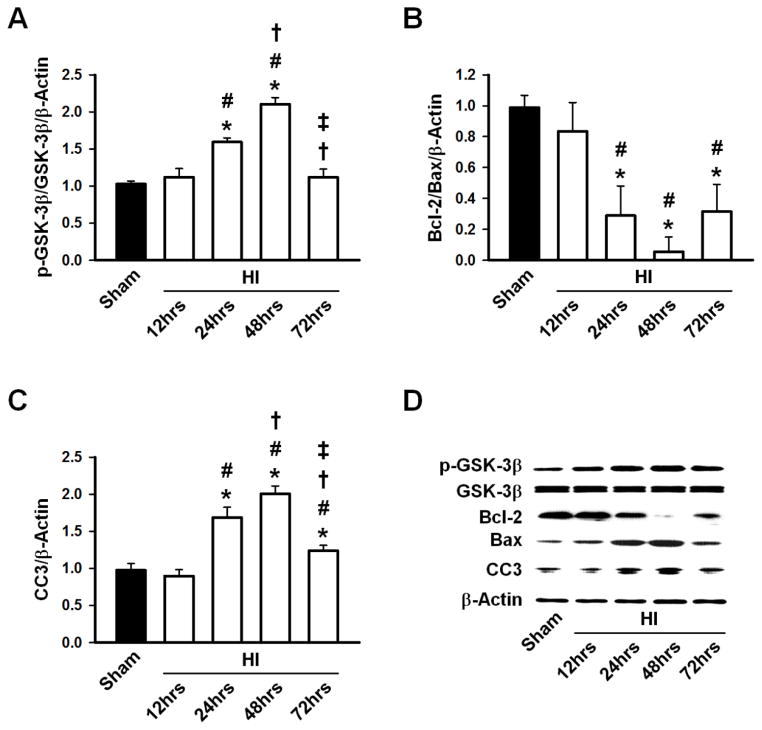
Figure 1.
A, Phosphorylated GSK-3β/GSK-3β ratio increased significantly at 24hrs and peaked at 48hrs before reaching Sham levels by 72hrs. B, Bcl-2/Bax ratio decreased significantly at 24hrs, reached a minimum at 48hrs and began to increase by 72hrs. C, Cleaved Caspase-3 (CC3) increased significantly by 24hrs and peaked at 48hrs, then gradually decreased by 72hrs. D, Representative Western blots of p-GSK-3β, GSK-3β, Bcl-2, Bax and CC3. n=6/group. * p<0.05 vs. Sham, # p<0.05 vs. 12hrs post-HI, † p<0.05 vs. 24hrs post-HI, ‡ p<0.05 vs. 48hrs post-HI.

