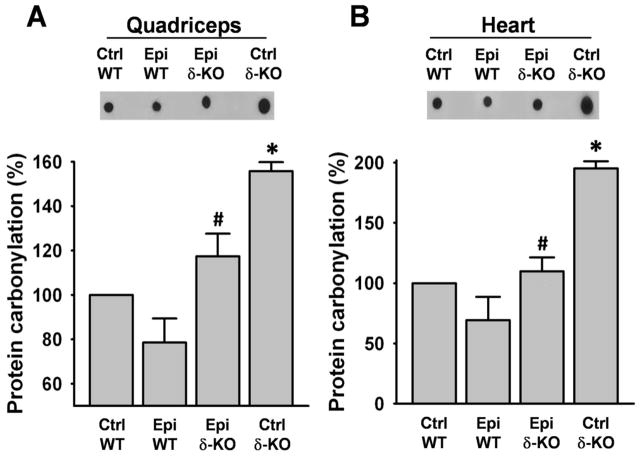
Figure 1. Effect of Epi on protein carbonylation.
Total protein carbonylation was determined by dot blots in quadriceps (A) and hearts (B) of water (vehicle) and Epi treated WT and δ-KO mice. Bargraphs report on the densytometric analysis of dot blots. Protein carbonylation was increased in the quadriceps and heart of Ctrl δ-KO as compared vs. Ctrl WT mice (*P<0.05). Epi treatment significantly reduced carbonylation levels (#P<0.05 Epi δ-KO vs Ctrl δ-KO). n=5 animals/group.

