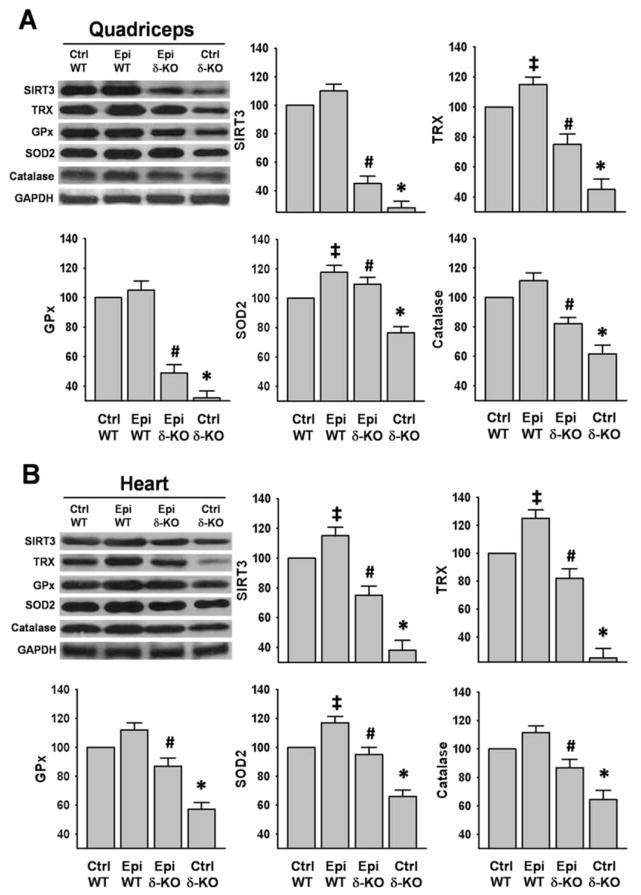
Figure 3. Effect of Epi on oxidative stress regulatory systems.
Protein levels of sirtuin-3 (SIRT3), thioredoxine (TRX), glutathione peroxidase (GPx), mitochondrial superoxide dismutase (SOD2) and catalase were analyzed by Western blot. Significant decreases were observed in Ctrl δ-KO mice as compared vs. Ctrl WT mice (*P<0.05). In the Epi δ-KO, treatment either partially restored or fully recovered their levels. (#P<0.05 Epi δ-KO vs Ctrl δ-KO). In Epi WT animals there was a significant increase in the levels of TRX and SOD2 in SkM, while in heart there was an increase in SIRT3, TRX, and SOD2 vs. Ctrl WT (‡P<0.05). The bargraphs report on densitometric analysis as: protein/GAPDH for each group. n=5 animals/group.

