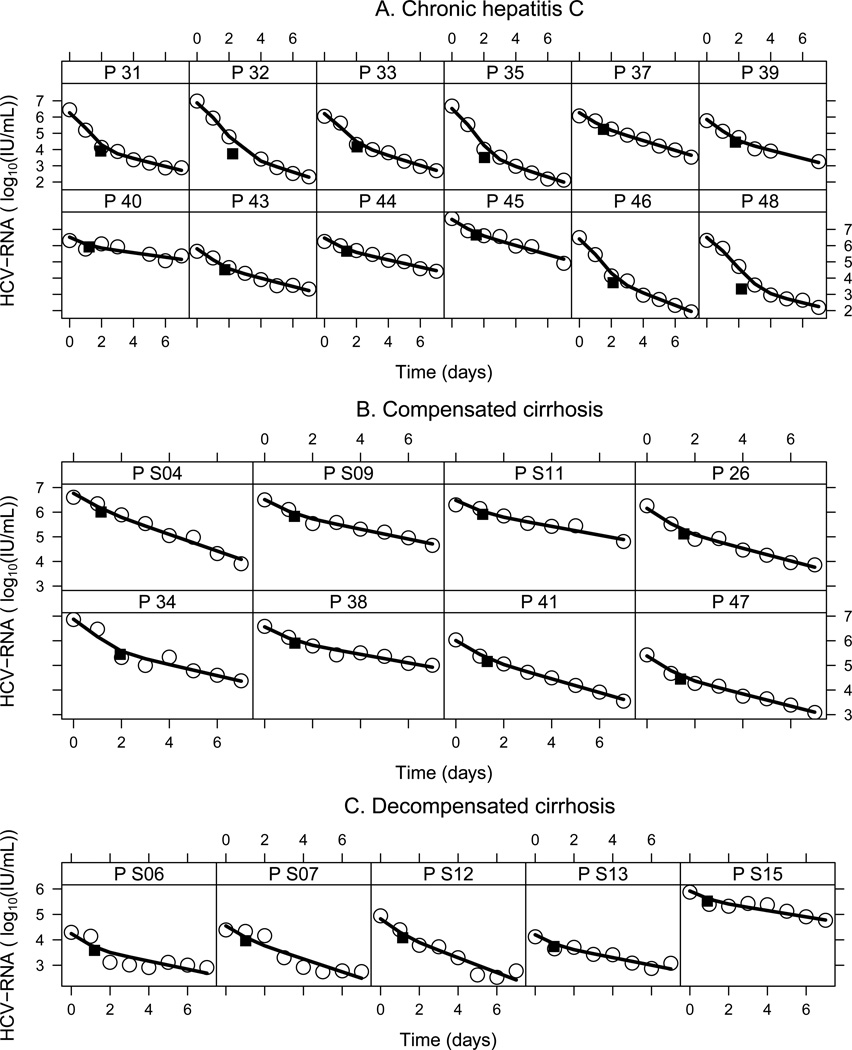
Figure 2.
Viral kinetics of individual patients based on predictions of the mathematical model (Eq. 1) under SIL monotherapy. Best fit curves (solid lines) of the model to the observed HCV RNA kinetic data (open circles) during daily 20 mg/kg/d dosing of SIL. The black square represents the predicted transition time between the first and second phases of viral decline (Table S2). A) Non-cirrhotic group. B) Compensated cirrhosis group. C) Decompensated cirrhosis group.

