
Fig. 3.
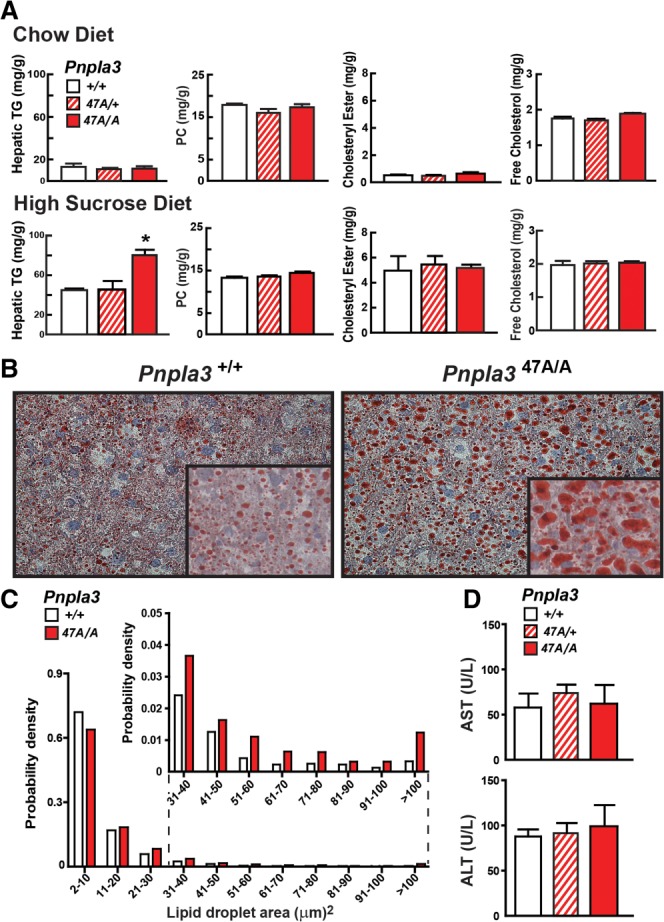
Hepatic TG content in Pnpla3S47A mice. Data in panels A-D are from the same experiment (n = 7 mice/group). Tissue and plasma samples were collected at the end of the feeding cycle. The experiment was repeated with similar results. (A) Hepatic lipid levels were measured in 13-week-old female wild-type (+/+), S47A heterozygous (S47A/+) and homozygous (S47A/A) KI mice fed a chow diet or high-sucrose diet (HSD) for 4 weeks. (B) Liver sections from sucrose-fed wild-type and S47A/A KI mice were stained with Oil Red O and viewed using a Leica microscope (DM2000) (magnification: 20×, inset 64×). (C) Size distributions of hepatic lipid droplets in wild-type and homozygous (S47A/A) KI mice. Oil Red O-stained slides were analyzed using ImageJ as described in the Materials and Methods. (D) Plasma levels of liver enzymes (AST and ALT). Values are means ± SEM. *P = 0.001.