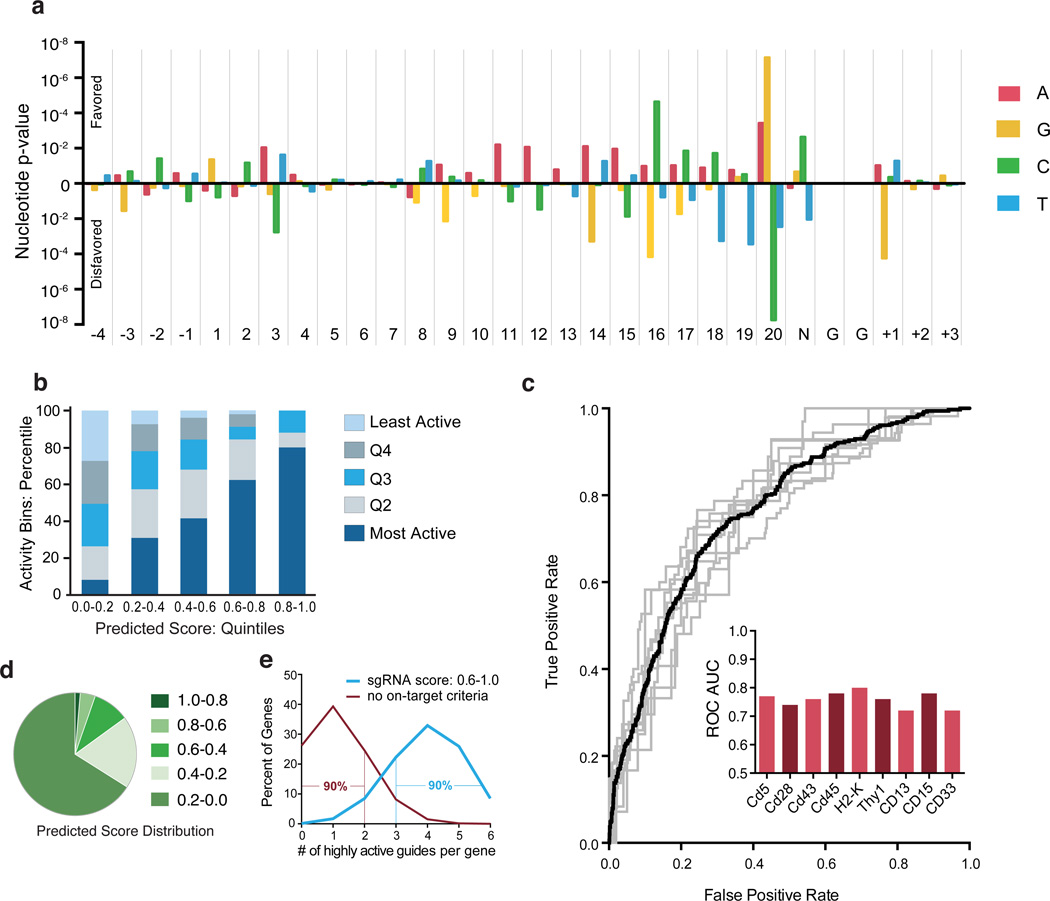
Figure 3.
Model of sgRNA activity. (a) p-values of observing the conditional probability of a guide with a percent-rank activity of >0.8 under the null distribution examined at every position including the 4 nt upstream of the sgRNA target site, the 20 nt of sgRNA complementarity, the PAM, and the 3 nt downstream of the sgRNA target sequence. p-values were calculated from the binomial distribution with a baseline probability of 0.2 using 1,841 CDS-targeting guides. (b) Performance evaluation of sgRNA activity prediction scores based on nucleotide features. Scores for 1,841 sgRNAs are divided by quintile (x-axis) and experimentally-determined activity within each prediction group is assessed by sgRNA percent rank, and also binned by quintile (y-axis). (c) Performance validation of sgRNA prediction algorithm. The model was trained on all possible combinations of 8 genes and tested individually on the remaining held-out gene. Each gray line indicates the ROC curve for a held-out gene. The black line is the mean ROC curve. The bar graph inset indicates the Area Under the Curve (AUC) for each gene. (d) Distribution of 1,841 sgRNAs across predicted score quintiles. (e) Simulation of the fraction of most-active sgRNAs, arbitrarily defined as the top 20% of sgRNA for a gene, in hypothetical libraries with 6 sgRNAs per gene. For a library designed with no on-target criteria (null, in red) the values are simply the binominal expansion of 0.2. For the hypothetical library that incorporates sgRNA scoring rules to enrich for highly-active sgRNAs (blue), the model predicts that the top two quintiles of scores (0.6 – 1.0) contain 66.3% of most-active sgRNAs, and thus the values are the binomial expansion of 0.663.

