Figure 8.

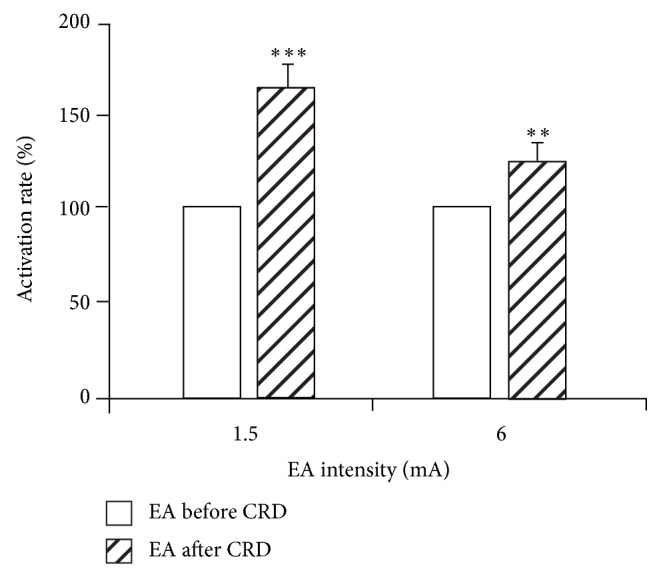
The activation rate of SRD neurons induced by EA at different intensities before and after CRD (left: before; right: after). After CRD, EA stimulation further increased the discharges of SRD neurons (** P < 0.01, *** P < 0.001).

The activation rate of SRD neurons induced by EA at different intensities before and after CRD (left: before; right: after). After CRD, EA stimulation further increased the discharges of SRD neurons (** P < 0.01, *** P < 0.001).