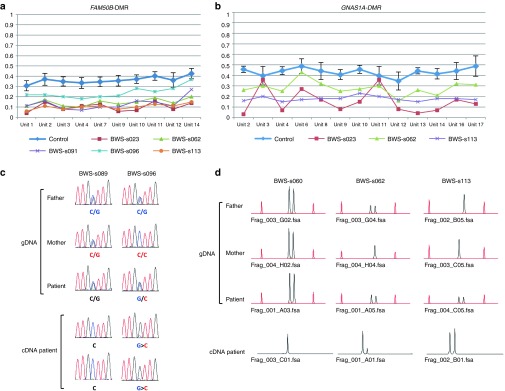
Figure 4.

Methylation analysis of FAM50B- and GNAS1A-DMRs and expression analysis of the FAM50B and GNAS1A genes. (a,b) Results of matrix-assisted laser desorption/ionization mass spectrometry analysis. Averages with SD of 24 normal controls are shown in blue. Methylation indexes of patients showing LOM are indicated in different colors. Ten CpG units analyzed for FAM50B-DMR covered 13 CpG sites, and 13 CpG units analyzed for GNAS1A-DMR covered 18 CpG sites. (c) Results of expression analysis of the FAM50B gene. Beckwith–Wiedemann syndrome (BWS) patient BWS-s096 was heterozygous for a coding SNP (rs6597007) with LOM and showed biallelic expression with a low peak of maternal expression, whereas monoallelic expression was seen in a patient with normally methylated differentially methylated regions (DMRs) (patient BWS-s089). In patient BWS-s096, maternal expression was noted in two independent analyses despite low-grade LOM. gDNA, genomic DNA. (d) Results of expression analysis of the GNAS1A gene. Patients BWS-s062 and BWS-s113, heterozygous for a deletion/insertion variation (rs143800311) with LOM, showed biallelic expression, whereas patient BWS-s060 possessed normally methylated DMRs and exhibited monoallelic expression. Maternal expression was noted despite low-grade LOM in patient BWS-s062. Red peaks are molecular markers. GOM, gain of methylation; LOM, loss of methylation.
