
Fig. 1.
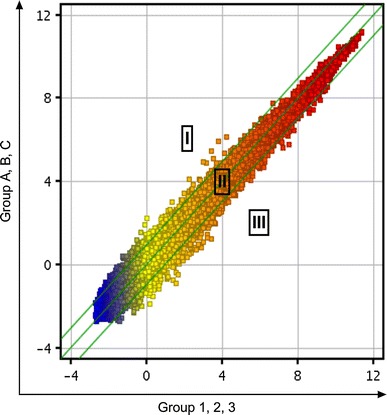
Representative scatter plot of changes in gene expression levels. Scatter plot is a visualization that is useful for assessing the variation (or reproducibility) between chips. All detected probe point values on the chip were plotted. The central diagonal lines were used to classify gene expression levels into three groups: group I, >twofold change increase in gene expression; group II, gene expression levels within a twofold change; and group III, >twofold change decrease in gene expression