
Fig. 3.
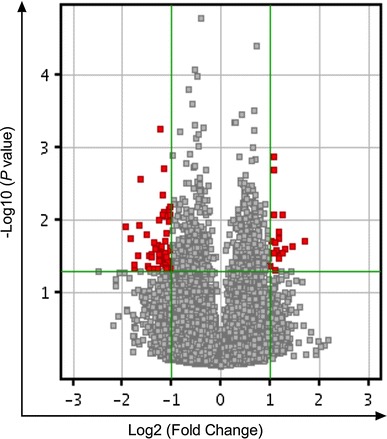
Volcano plot of DEGs. The vertical lines correspond to twofold up and down, respectively, and the horizontal line represents a P value of 0.05. So the red point in the plot represents the differentially expressed genes with statistical significance