
Fig. 7.
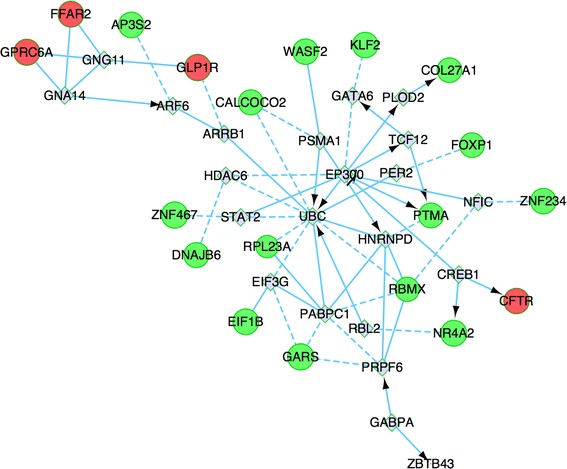
Interaction network of the differentially expressed gene. Genes with more links are shown in bigger size. Proteins shown in red are encoded by up-regulated genes, while those in green are encoded by down-regulated genes, the gray represents the predicted genes. Arrow line represents definite control relationship, dotted line represents predicted control relationship, solid line represents inhibition