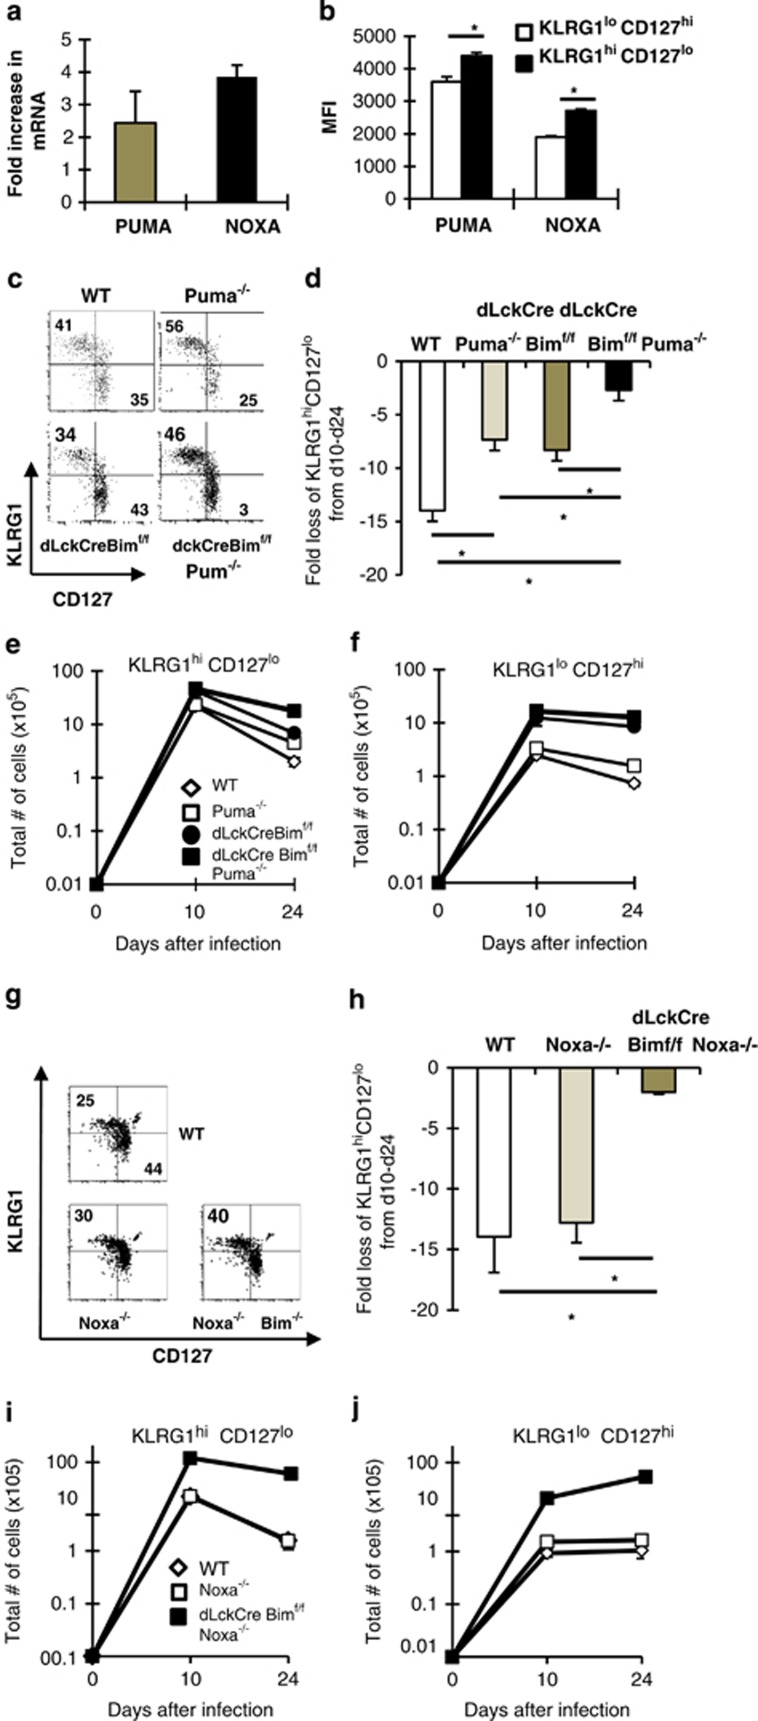
Figure 7.
Bim, Noxa and Puma contribute to effector T-cell contraction. (a) Groups of C57BL/6 mice were infected with LCMV and on day 24 were killed and mRNA was isolated from sorted KLRG1hiCD127lo and KLRG1loCD127hi CD8+CD44hi T cells. Results show the fold increase in Puma and Noxa mRNA in KLRG1hiCD127lo relative to KLRG1loCD127hi T cells as assessed by real-time RT-PCR. Cycle counts for Puma and Noxa were normalized to actin before assessment of fold increase. (b) Groups of C57BL/6 mice were infected with LCMV and on day 24 were killed and spleen cells were stained with MHC tetramers and antibodies against CD8, CD44, KLRG1, intracellularly with antibodies against Noxa and Puma. Results show the mean fluorescence intensity of the Noxa or Puma signal in pre-memory KLRG1loCD127hi (white bars) and effector KLRG1hiCD127lo T cells (dark bars) ±S.E.M. (c–f) Groups of WT, Puma−/−, dLckCre+bimf/f and Puma−/−dLckCre+bimf/f were infected with LCMV and then killed on days 10 and 24 after infection. (c) Dot plots show the levels of KLRG1 (y axis) and CD127 (x axis) within CD8+CD44hiGP33-gated cells. (d) Graph shows the fold loss of KLRG1hiCD127lo cells between days 10 and 24. (e and f) Graphs show the total numbers of KLRG1hiCD127lo and KLRG1loCD127hi CD8+CD44hi GP33-specific T cells ±S.E.M. from either WT, Puma−/−, dLckCre+bimf/f and Puma−/−dLckCre+bimf/f mice. (g–j) Groups of WT, Noxa−/−, dLckCre+bimf/f and Noxa−/−dLckCre+bimf/f were infected with LCMV and then killed on days 10 and 24 after infection. (g) Dot plots show the levels of KLRG1 (y axis) and CD127 (x axis) within CD8+CD44hiGP33-gated cells and (h) graph shows the fold loss of KLRG1hiCD127lo cells between days 10 and 24. (i and j) Graphs show the total numbers of KLRG1hiCD127lo and KLRG1loCD127hi CD8+CD44hi GP33-specific T cells ±S.E.M. from either WT, Noxa−/−, dLckCre+bimf/f and Noxa−/−dLckCre+bimf/f mice on days 10 and 24 after infection. Results are pooled from two to three independent experiments. *Significant difference as assessed by Student's t-test and P≤0.01

