Figure 3.
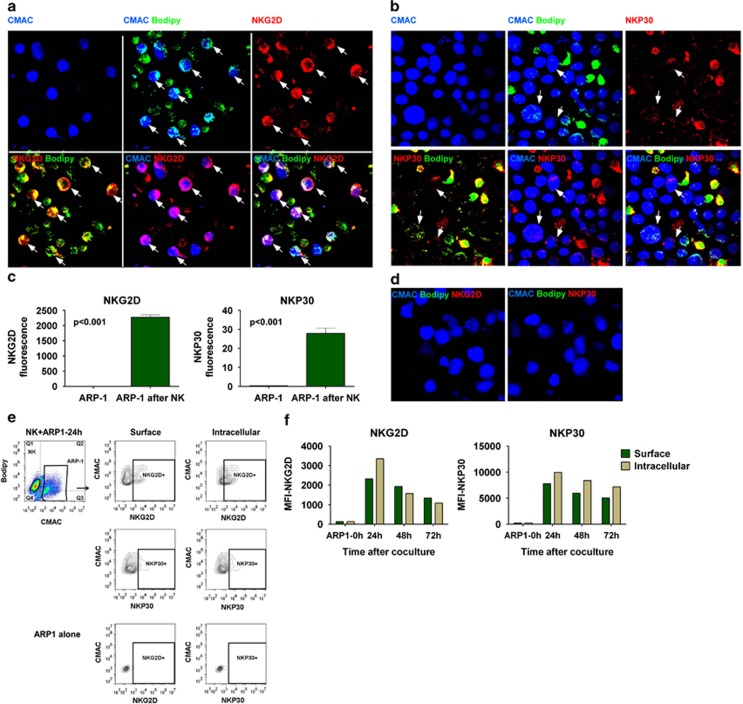
NKG2D and NKP30 are transferred into MM cells: (a) NKG2D and (b) NKP30 in ARP1 cells after co-culturing with CB-NK for 20 min. ARP1 cells were stained in blue (CMAC) and CB-NK in green (bodipy). NKG2D and NKP30 are indicated in red. All the images represent the same showing different combinations of the three colors. Arrows indicate ARP1 cells with NKG2D or NKP30. (c) Fluorescence values obtained from images in panels a and b. Bars represent mean±S.E.M. (d) As control, ARP1 cells alone were stained for NKG2D and NKP30 with the same settings than in images a and b. Results from panels a to d were confirmed in three different experiments. (e and f) Detection by flow cytometry of NKG2D and NKP30 in ARP1 cells after 24, 48 and 72 h of co-culture with CB-NK. ARP1 cells were gated based on CMAC staining. (e) Representative plot of the experiment at 24 h of co-culture. ARP1 cells unstained alone were used as control. (f) Median fluorescence intensity (MFI) values for NKG2D and NKP30 in ARP1 cells at the different times of co-culture, performing both surface and intracellular staining

