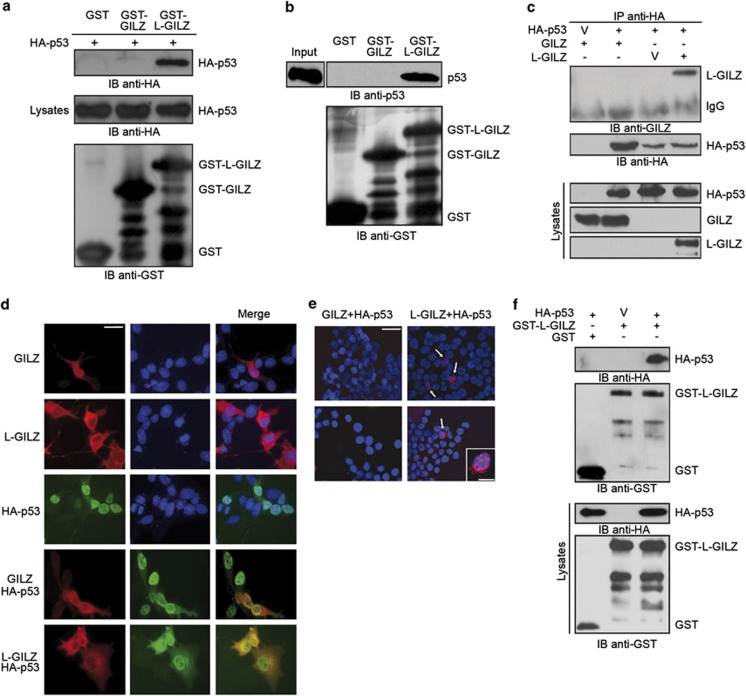
Figure 1.
L-GILZ interacts with p53. (a) Cell lysates of HA–p53-transfected p53−/− HCT116 cells were incubated with GST, GST–GILZ or GST–L-GILZ attached to glutathione–sepharose beads. Proteins bound to the resin were eluted, resolved by SDS-PAGE, and subjected to Western blot using anti-HA antibody. Immunoblot (IB) of immobilized bait proteins that were incubated in the absence of target protein shows equal amounts of GST-tagged proteins. IB of lysates shows comparable p53 transfection levels across groups. (b) The in vitro transcription/translation product of full-length wild-type p53 was incubated with GST, GST–GILZ or GST–L-GILZ attached to glutathione–sepharose beads. Proteins bound to the resin were eluted and analyzed by Western blot using anti-p53 antibody. ‘Input' indicates 10% volume of the in vitro translated product used in the pull-down assay. IB of GST-tagged proteins was performed to show that equal amounts of immobilized bait proteins were used. (c) p53−/− HCT116 cells were co-transfected with pcDNA3-GILZ or pcDNA3-L-GILZ together with HA–p53 vector. Immunoprecipitation (IP) was performed with anti-HA antibody, and immunoreactive proteins were revealed with anti-GILZ or anti-HA antibodies. V, vector. Whole-cell lysates were loaded to control for plasmid expression (lower panels). (d) Microscopic analysis of GILZ/L-GILZ (red) and p53 (green) localization in GILZ-, L-GILZ-, HA–p53-, GILZ/ HA–p53-, or L-GILZ/ HA–p53-transfected p53−/− HCT116 cells. DAPI (blue) was used as a nuclear counterstain. Right panels show merged images. Scale bar represents 30 μm. (e) In situ PLA in p53−/− HCT116 cells transfected with HA–p53 together with GILZ or L-GILZ. Cells were fixed and processed by incubating with a goat anti-GILZ and mouse anti-HA antibody mixture, followed by an anti-goat PLA-plus probe for GILZ and L-GILZ and anti-mouse PLA-minus probe for HA. Representative merged images from two experiments with the PLA (red) and DAPI (blue) channels are shown. No signals were observed in non-transfected or single-transfected cells (not shown). Positive cells are indicated by arrows. Scale bar represents 30 μm. The insert shows a single cell at 100 × magnification. Scale bar represents 10 μm in the insert. (f) H1299 cells were co-transfected with GST–L-GILZ or GST (in pEBG) together with either HA–p53 or HA–empty vector. GST–L-GILZ and GST were purified by glutathione–sepharose resin. Co-purified p53 was detected by anti-HA antibody, and purified GST–L-GILZ and GST were detected by anti-GST antibody. Lysates were analyzed by Western blot using anti-GST or anti-HA antibodies

