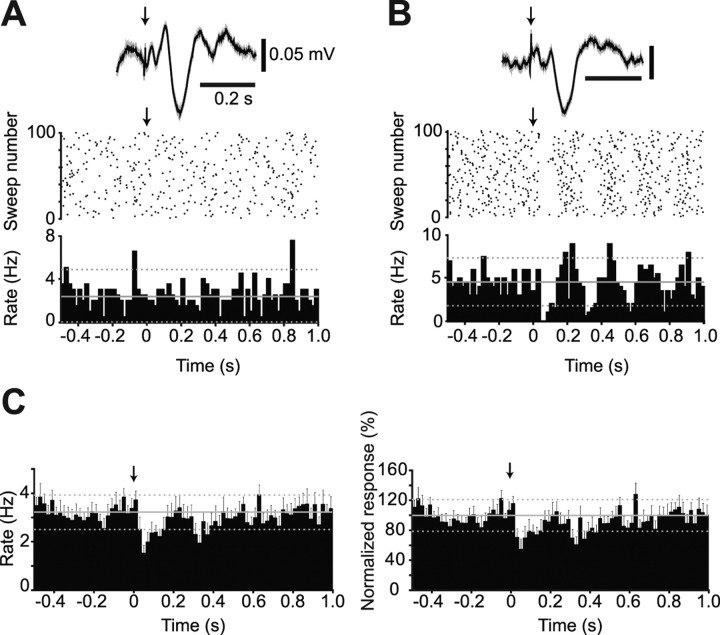
Figure 6.
Individual and population responses of dopaminergic substantia nigra neurons to an aversive electrical stimulus. A, PSTH and raster plot showing the activity of an individual dopaminergic neuron, which exhibited no response to the stimulus, from 0.5 s before to 1 s after stimulus delivery (denoted by arrow at time = 0). Above is the evoked response in the cortex associated with the electrical stimulation, confirming stimulus efficacy. B, PSTH and raster plot showing the inhibition of an individual dopaminergic neuron in response to stimulus delivery. C, When all neurons were pooled into a single population, a small but significant inhibition in response to the electrical stimulus was observed, in terms of the mean firing rate (left), and when data were normalized to baseline mean rate (right). PSTHs in A–C are plotted in 20 ms bins, with the baseline mean rate (solid gray line) ± 2 SDs of this mean (dashed gray lines). Error bars in C indicate SEMs.

