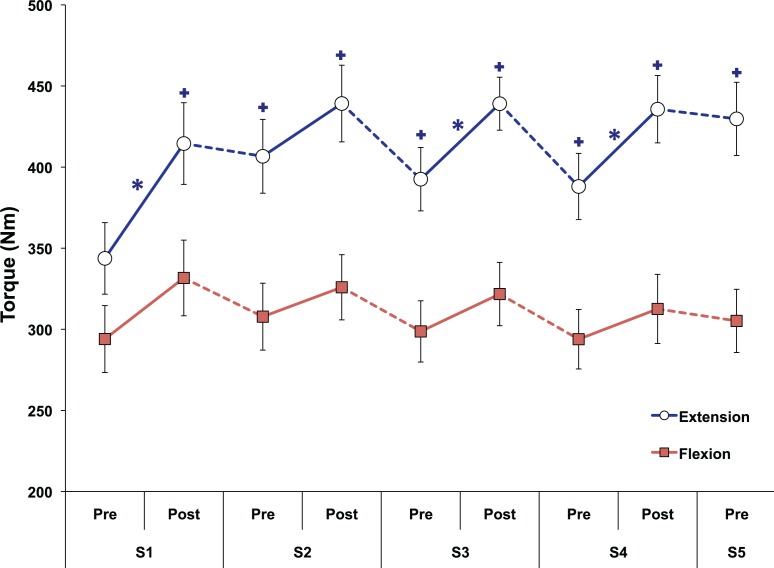
Figure 5.
Trunk flexion and extension strength (Nm) of both THF groups over the course of the treatment sessions (n = 10 for LBP-THF and 8 for A-THF). Solid lines indicate changes within a session (primary outcome measure); dotted lines indicate changes between sessions (secondary outcome measure). Standard error bars are shown. Significant decreases within a session shown with *; significant increases from S1:Pre shown with a +.

