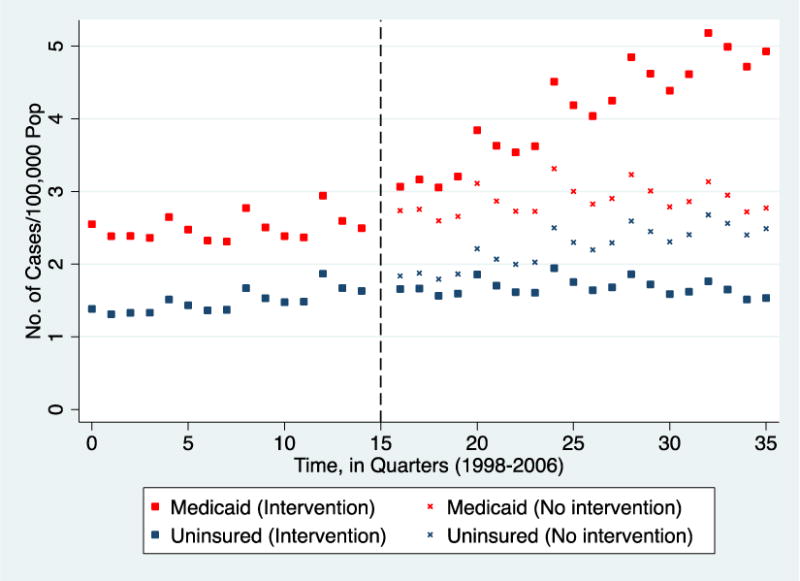
Figure 2. Quarterly population-adjusted number of Medicaid beneficiaries and Uninsured patients who received musculoskeletal procedures.

Red/blue square plots: Observed population-adjusted number of Medicaid/Uninsured patients respectively, with the intervention.
Red/blue “x” plots: Expected population-adjusted number of Medicaid/Uninsured patients respectively if the intervention had not occurred.
Dashed line: Time of intervention.
At quarter 35 (roughly 5 years after the intervention), approximately 5/100,000 (red square) patients treated were Medicaid beneficiaries compared to 2.8/100,000 (red “x”) if the intervention had not occurred. Additionally, the number of uninsured patients at quarter 0 and 35 were 1.4/100,000 and 1.5/100,000 respectively with little variation in the quarters in between.
