
Fig. 4.
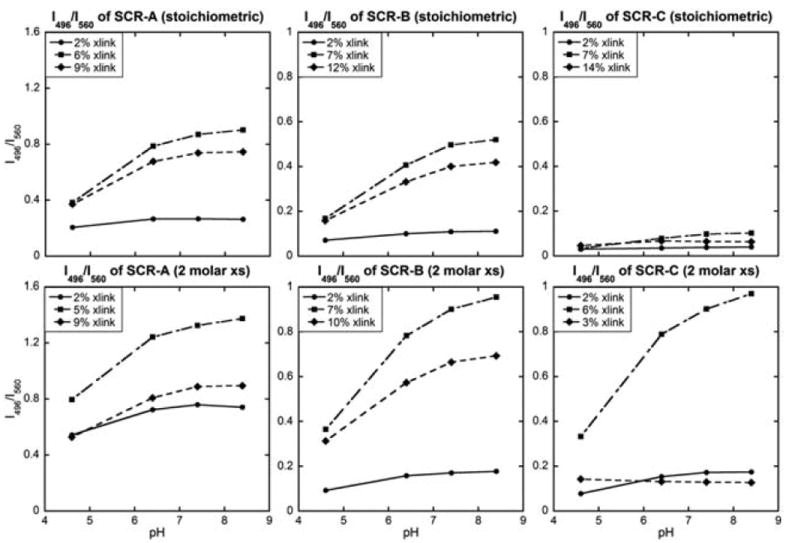
Relationship between solution pH and the fluorescence intensity ratio at two fixed wavelengths (496 nm and 560 nm) for SCR-A, SCR-B and SCR-C (left, middle, right, respectively) with stoichiometric (top) or 2 molar excess amounts of EDCI (bottom). The excitation wavelength was 433 nm.