
Fig. 8.
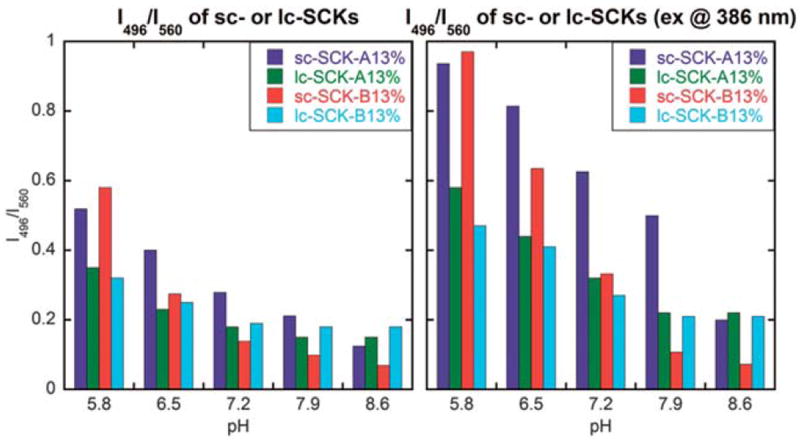
Relationship between the solution pH and the fluorescence intensity ratio at two fixed wavelengths (496 nm and 560 nm) for sc-SCK-A, sc-SCK-B, lc-SCK-A and lc-SCK-B (left, excited at 433 nm, the maximum absorbance wavelength of A and B; right, excited at 386 nm, the maximum absorbance wavelength of the nanostructures).