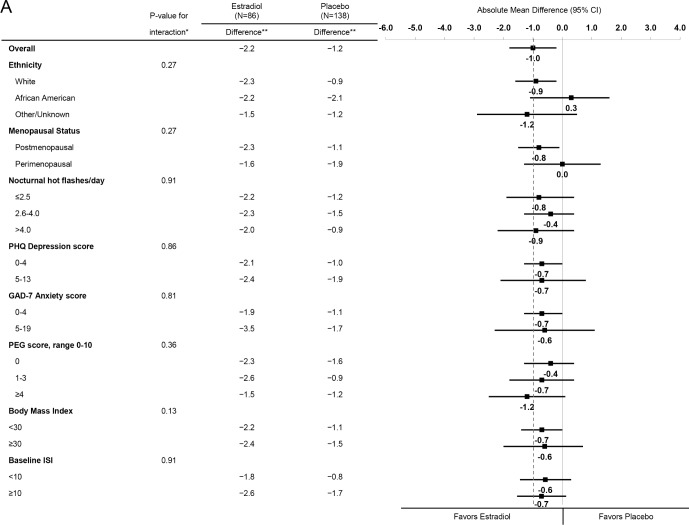
Figure 3A.
Mean change in PSQI from Baseline to Week 8 by treatment assignment overall and within risk subgroups. The dotted vertical line indicates the overall absolute mean difference between treatment groups. * Adjusted absolute mean differences and interaction P-values are computed from a repeated measures model estimating mean week 4 and 8 PSQI as a function of treatment arm, site, baseline PSQI, the subgroup of interest, and the interaction between treatment assignment and subgroup. ** Mean week 8 PSQI – baseline PSQI difference.

