
Figure 5.
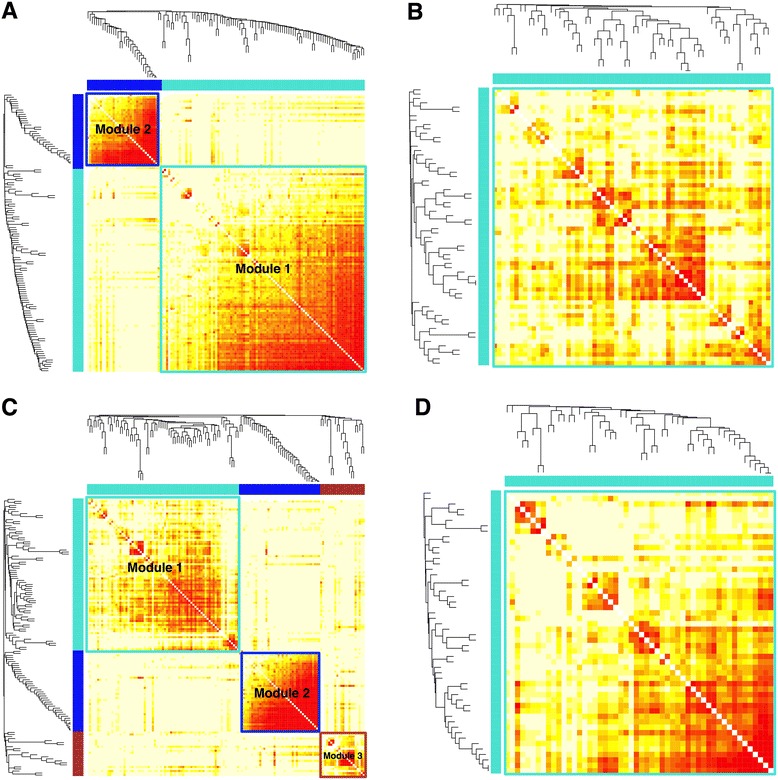
Network modules identified by weighted gene co-expression network analysis. Co-expression networks for: (A) all leukemic cells; (B) GMPs; (C) Leukemia 1 cells; and (D) Leukemia 2 cells. Each row and column corresponds to a gene. The modules are indicated by the color bars next to the heat map. Light color in the heat map indicates low topological overlap and progressively darker red represents higher topological overlap.