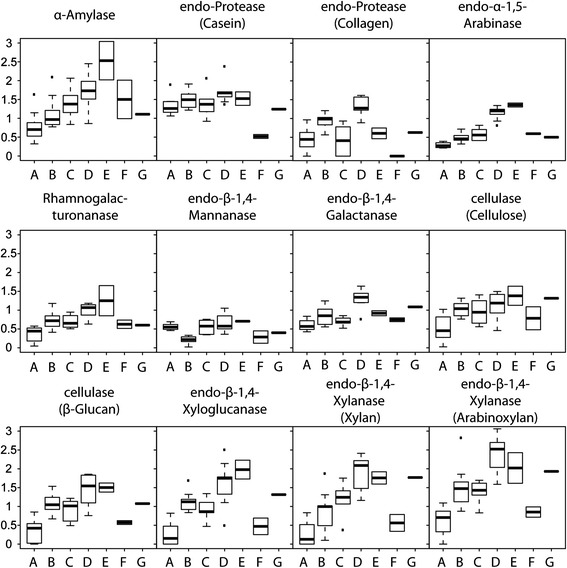
Figure 2.

Enzyme activity of cultivar haplotypes. Activity of 12 carbohydrate active enzymes for the seven fungus garden ITS haplotypes (A-G) measured with an AZCL-plate assay with the Y-axis representing the diameter of the halo formed after a positive enzyme reaction. The spectra of 12 enzyme activities were significantly different between the fungus garden ITS haplotypes (see text for details). Boxplots represent the 1st and 3rd quartile with the median as an internal line, whiskers are the approximate 95% confidence intervals and individual dots are outliers.
