Figure 1.

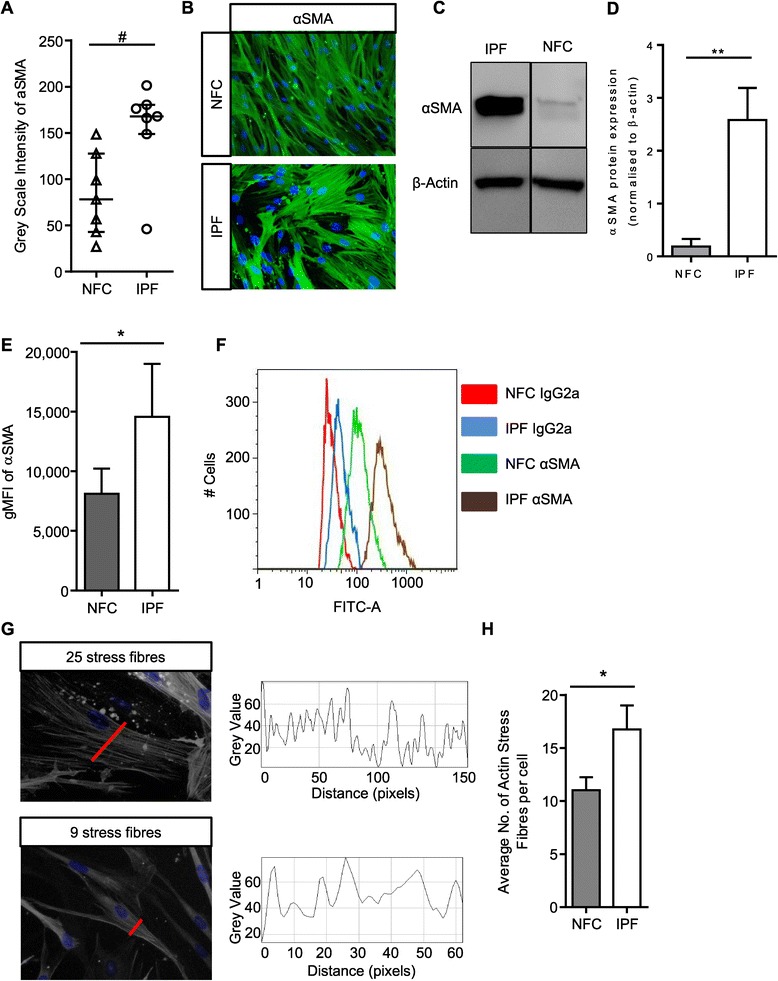
IPF myofibroblasts have increased basal αSMA expression and stress fibre formation. (A) HLMF αSMA expression was measured by grey scale intensity in n = 7 NFC and n = 7 IPF donors; a minimum of 10 random cells were measured in one field for each donor. IPF HLMF’s had significantly higher intensity of αSMA in comparison to NFC donors P = 0.0111, Mann–Whitney. (B) Immunofluorescent images displaying αSMA staining and actin stress fibers in the cytoplasmic matrix. (C and D) Western blot analysis of αSMA expression in NFC (n = 3) and IPF-derived (n = 3) HLMFs, **P = 0.0026. The detected band was at the correct molecular weight of 42 kDa for αSMA (E and F) the mean fluorescent intensity (MFI) of αSMA expression assessed by flow cytometry. IPF (n = 4) donors showed significantly higher expression than NFC (n = 4), P = 0.0159. (G) Illustration of how the αSMA stress fibres were assessed. A macro recorded the number of fibres per individual cell. Each fibre represents a peak in grey value and the number of peaks equating to the number of stress fibres was then counted per cell. A minimum of 10 cells were measured per donor. (H) The results show that the number of actin stress fibres were significantly higher in IPF (n = 8) donors in comparison to NFC (n = 8) donors P = 0.0437 (Un-paired t-test). Results are presented as median ± IQR, #P < 0.05 (Mann–Whitney), or mean ± SEM *P < 0.05, **P < 0.01 (Unpaired t-test).
