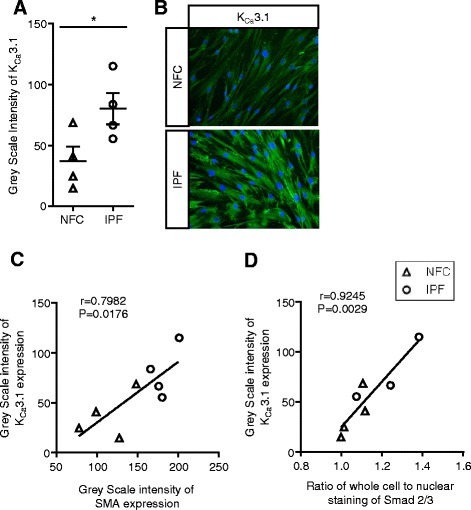
Figure 2.

K Ca 3.1 protein expression in HLMFs. (A) KCa3.1 protein expression in HLMFs was measured using the grey scale intensity and was significantly higher in IPF (n = 4) in comparison to NFC-derived cells (n = 4), mean ± SEM, *P < 0.05 (Un-paired t-test). (B) Examples of KCa3.1 immunofluorescent staining in both NFC and IPF donors. (C) The correlation between KCa3.1 and αSMA expression in HLMFs, r = 0.798, P = 0.0176. (D) The correlation between KCa3.1 and whole cell nuclear Smad expression in HLMFs, r = 0.925, p = 0.0029.
