Figure 1.

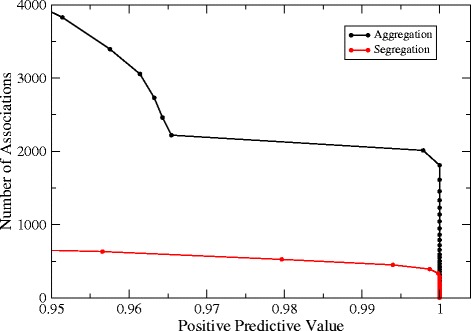
Number of significant aggregations (black) and segregations (red) found in the observed presence-absence matrix versus the positive predictive value (see Methods ).

Number of significant aggregations (black) and segregations (red) found in the observed presence-absence matrix versus the positive predictive value (see Methods ).